The AI Boom and Its Risks · Part 2
How Far Could Stocks Fall?
This is the second in what I expect to be a series of five posts that chart the consequences of the AI boom and the risks of it deflating. The first post used the Federal Reserve’s large-scale macroeconomic model to estimate the consequences of the AI boom. This post is about the risks of a stock market decline. The next post will discuss how much a given fall in the stock market would affect consumption and economic growth. After that I plan to tackle the financial system and the economy’s shock absorbers.
One critical piece in understanding the risks we face in the economy today is understanding how much stocks could fall if it turns out we are in a bubble. It is hard to answer how much the stock market would decline if there is a bubble that bursts because my normal presumption is that I cannot outguess the market, and thus that it is not actually a bubble now. That is why I keep the bulk of my financial investments in the broad stock market (Vanguard’s VT specifically, which effectively holds all of the world’s stocks). I am not currently making an exception to that rule, so, putting my mouth where my money is, a decline is not my central expectation.
That said, if forced to answer the question of how much the stock market would fall if it is in a bubble, I would use a number of methodologies. A 50 percent decline in the biggest AI stocks would by itself mean an 11 percent decline in the broader market, not counting any knock-on effects on other sectors. Another method is to look at various valuation metrics and combine them with assumptions about earnings declines. These give answers in the range of 18 to 41 percent. All of these declines are much larger than what options markets treat as likely; in fact, options pricing suggests an unusually low chance of a large market decline—but, of course, if the market is misvalued these options may be too. Regardless, anything like the 50 percent decline seen when the dot-com bubble burst is a very low-probability tail risk, and if forced to pick a baseline I would choose 25 percent.
Just because many past technologies have ended in bubbles does not mean it is a bubble now
Bubble proponents note that, historically, exciting new technologies often lead to bubbles, like railroads, radio and the internet. This is not actually always true—jet planes and smartphones were not bubbles. Regardless, even if major new technologies are eventually bubbles, that does not provide much insight about whether it is in a bubble at any given moment. If the stock market rises a lot before losing some of its gains, then calling a bubble today would have been wrong—as the 1996 test below shows.
Being early to call a bubble is not prescient—it is wrong. I first personally called the Tesla bubble in April 2017 (the call was made to friends, not in writing). That is when Tesla’s market value exceeded both Ford’s and General Motors’. At the time, Tesla was making about 76,000 cars a year, Ford about 7 million and General Motors about 10 million. It was an obviously insane valuation. And yet Tesla is up about 1,800 percent since I made that call. During this period I mentally shorted Tesla several times—but fortunately never acted on it and kept my money in Vanguard index funds. And yes, Tesla may fall one day, but unless it falls about 96 percent or more—which I do not think even their biggest critics expect—my call will have been wrong.
One model of a technology explosion is a process where each year there is an 85 percent chance of a 30 percent increase and a 15 percent chance of a 50 percent decline. The expected return is 18 percent—a good investment—but it is also inevitably the case that a 50 percent decline will happen and a bubble caller will be superficially vindicated.
Or consider another process, which could be operative today, which is that there is a small probability of a massive return to a company. It is easy to imagine that with Anthropic or OpenAI. In this case, it could be that in the majority of the cases the bubble callers will be vindicated—and not just superficially—but on average they will still be wrong and it could still be worth investing.
But let’s get more concrete on where we are today and how it compares to 2000.
Today does not appear to be 2000
Since the end of 2019 the S&P 500 has risen about 135 percent while its companies’ earnings have risen about 125 percent. The biggest drivers of today’s stock market boom are mature companies with very high revenue that is growing very quickly like Alphabet, Microsoft and Nvidia. Over just the last three years, Nvidia’s revenue has risen more than ninefold, and Alphabet’s and Microsoft’s have each risen about 60 percent. Driving much of this is the emergence of AI, a technology that has been adopted faster than anything we have seen before—including the personal computer and the internet.
The demand is also different. Much of the late 1990s investment boom was in building out the fiber network for the internet. Much of it was based on a “build it and they will come” theory that was not quickly vindicated—by one widely cited estimate only 5 percent of the fiber was lit in the early 2000s, although others put it closer to a third. Today the investment boom is in data centers and so far basically all the chips are being used to the max—in fact there is so much excess demand that the price of renting an Nvidia H100 has risen more than 50 percent since last December.
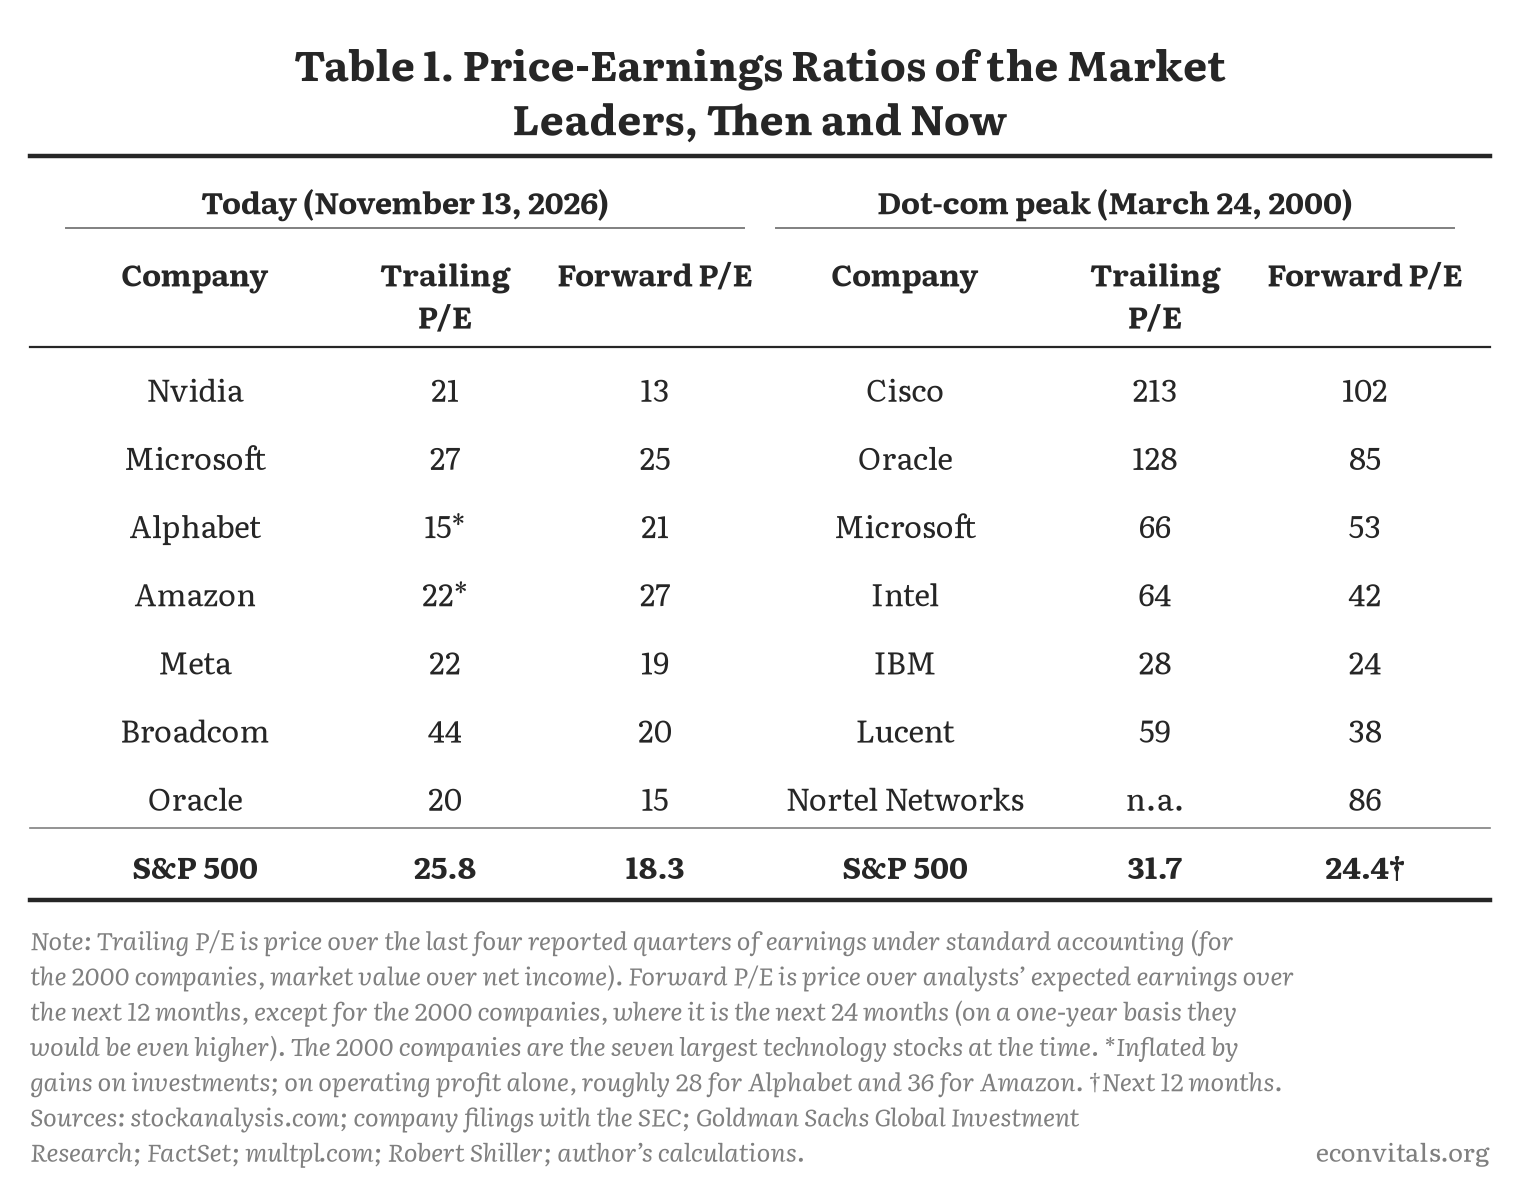
You can see the large difference from 2000 by comparing some of the leading stocks of the dot-com bubble with the leaders now (Table 1): their prices relative to both current and expected earnings were much, much higher in 2000 than they are now. Cisco, for example, was trading at 213 times its trailing earnings as compared to 21 for Nvidia today. Or comparing to expected earnings, Cisco was at 102 then (on earnings two years ahead, which flatters it) as compared to Nvidia at 13 today.
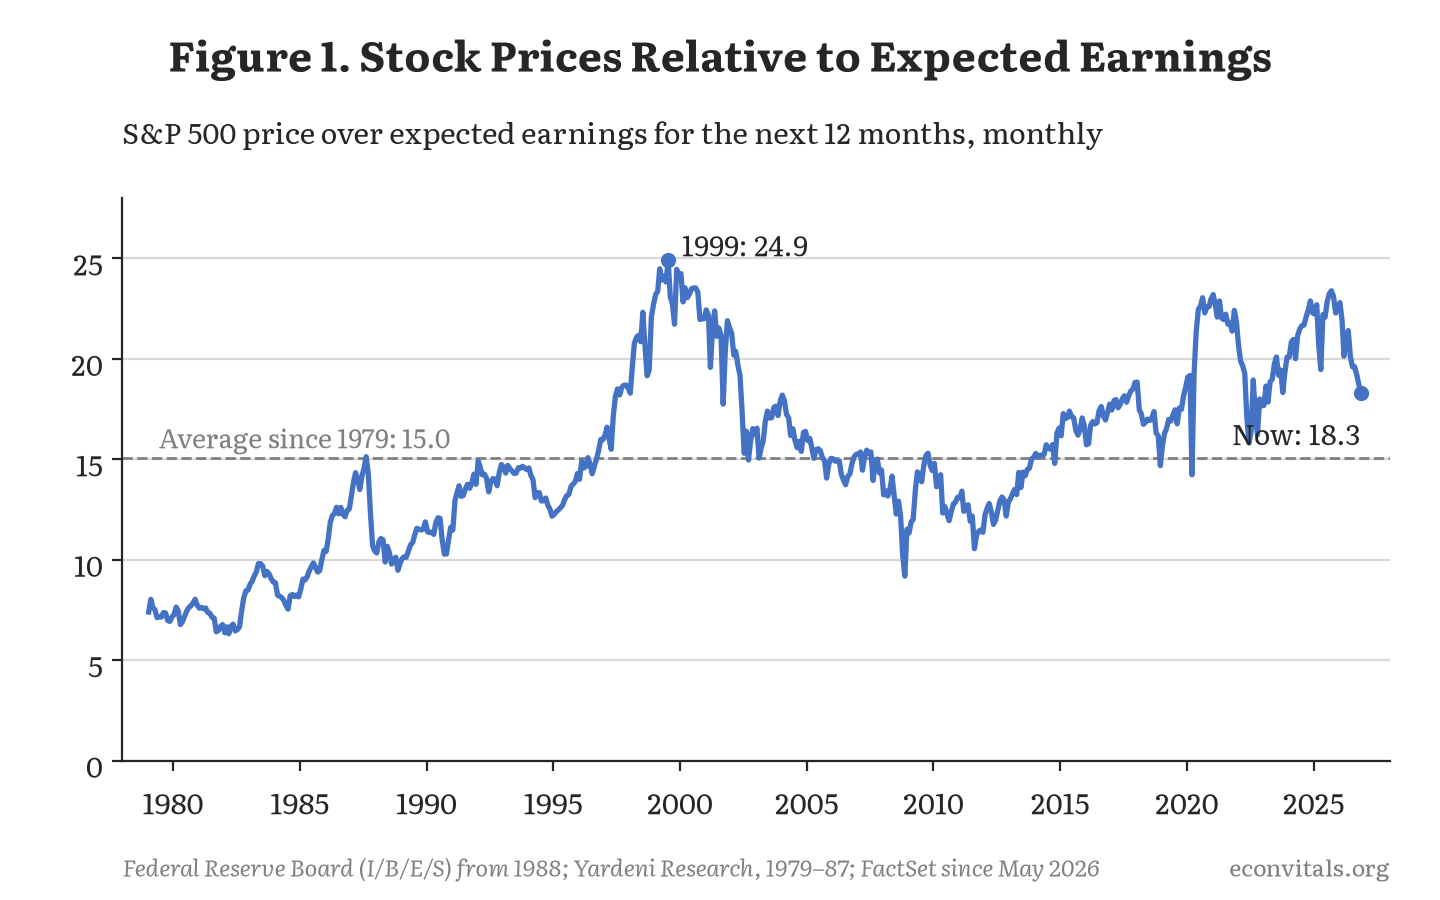
The aggregate market tells a similar story. The ratio of stock prices to expected earnings over the next twelve months is 18.3, the 77th percentile of its history since 1979 (Figure 1). This is well below the 24 to 25 of 1999 and 2000.
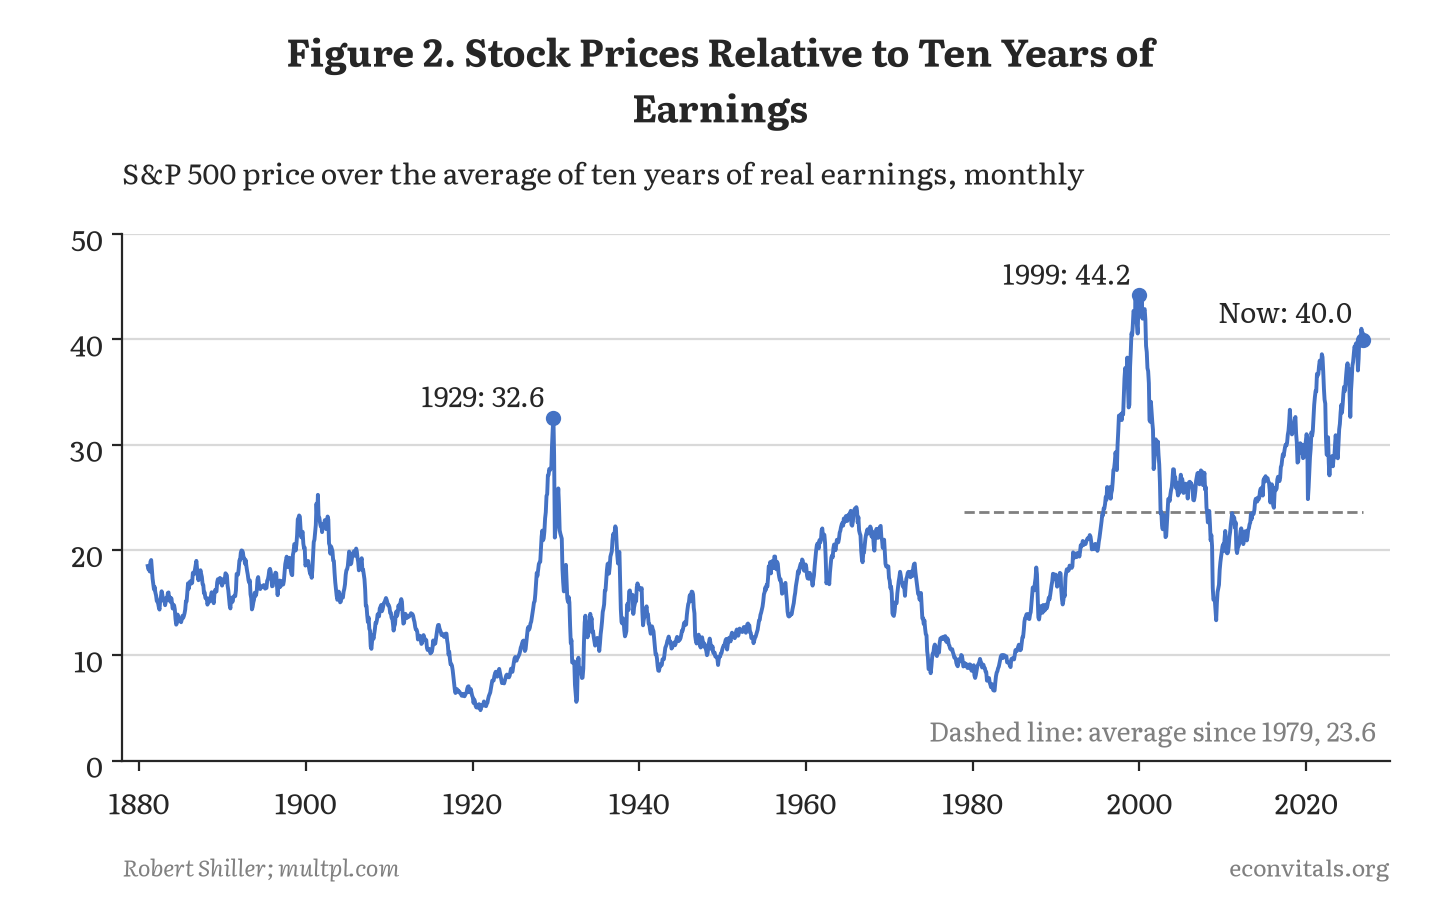
Of course, the expected earnings may themselves reflect bubbly forecasts. Another measure is Robert Shiller’s cyclically adjusted price-earnings ratio (aka CAPE) which compares stock prices to inflation-adjusted earnings averaged over the previous ten years. The advantage of this measure is that it averages over business cycles so it does not extrapolate too much from what might be a temporary boom in earnings. The disadvantage is that if there are genuine changes in earnings over time it can be slow to update based on them. This measure stands at 40 today, the 99th percentile of its range since 1881 but still a bit below its 1999–2000 peak of 44 (Figure 2).
The high stock market is about profits, not multiples
The high valuation of stocks has been more a story of rapidly rising profits (which is missed by the Shiller CAPE measure, which is very lagged) than of increases in multiples on these earnings. You can see this in the profit share (Figure 3), which had been stable for decades after World War II but has been steadily rising since 2000 and recently has reached a new record.
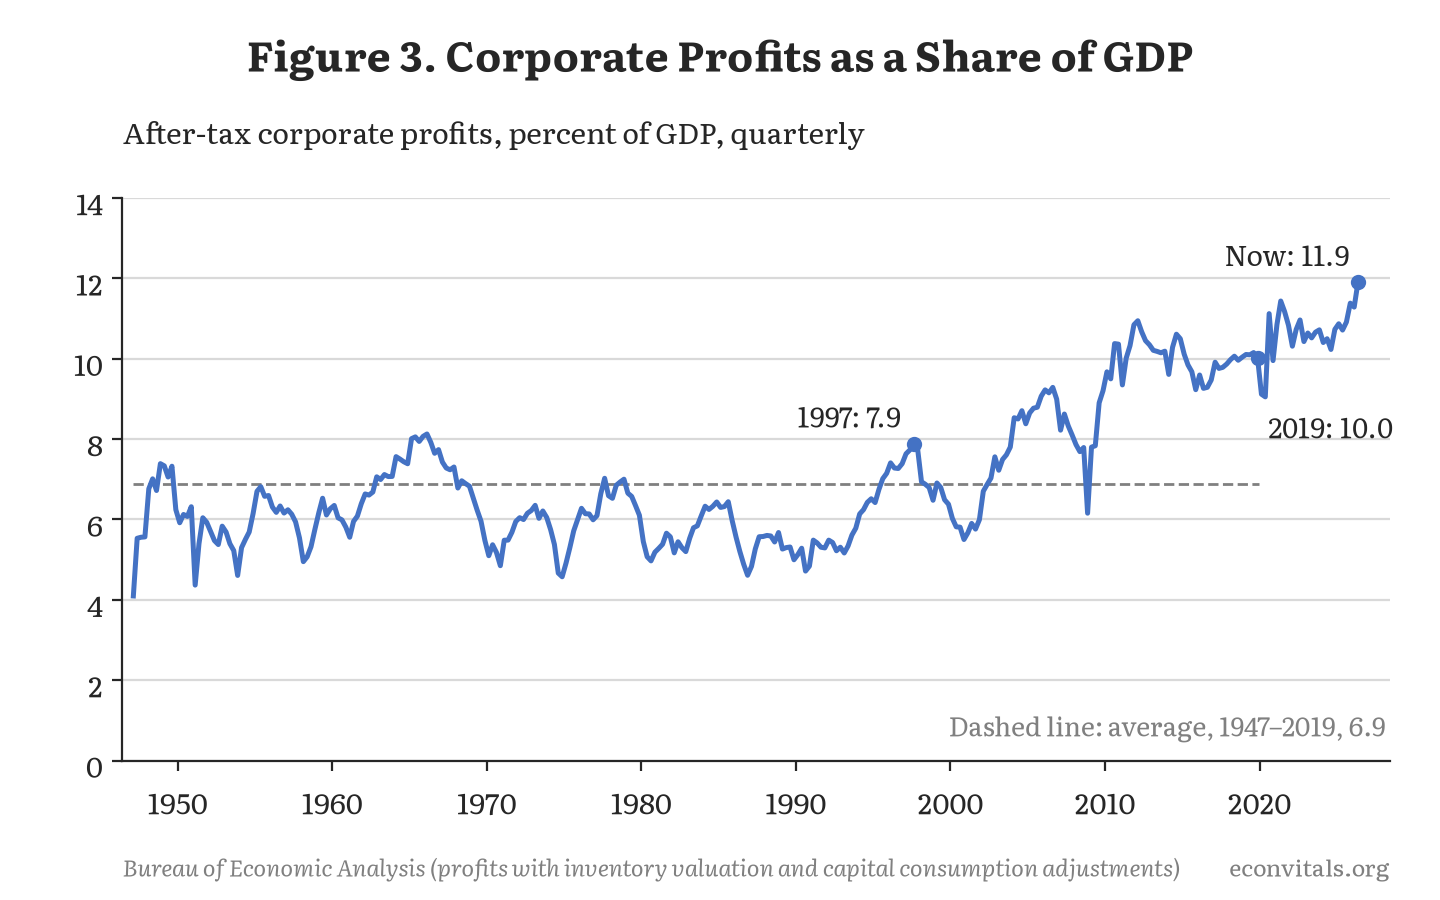
Note this too is very different from 2000, when the profit share had been falling—from 7.9 percent of GDP in 1997 to 6.0 percent at the stock market’s peak in early 2000.
This suggests that the recent run-up in stock prices has been more about earnings than multiples. So the biggest worry going forward is less about a dramatic decline in future earnings growth than it is about a dramatic decline in actual earnings.
Although one should also be worried that multiples fall. In some ways the steady multiple itself is a puzzle given that alternative investments to stocks have gotten more attractive. The real interest rate, as measured by 10-year TIPS, has risen from generally being less than 1 percent in the years prior to COVID to above 2 percent for the last six months.
The next section considers both falling earnings and falling multiples to size the potential fall if a bubble bursts.
How far would the stock market have to fall to get back to “normal”?
Notwithstanding the high and rising revenue of tech companies, it is not hard to imagine a large stock market decline. The valuations of AI-related stocks are premised on both an increase in productivity from the technology that makes it desirable to businesses and consumers and also the ability to monetize that by building moats. The second assumption, especially, is at best uncertain.
Relatedly, the companies could be victims of their own success. The more the models improve, the more people can use older, cheaper models—including extremely cheap open-weight models. In fact, there are some signs that revenue for OpenAI and Anthropic is no longer increasing as fast as it was: The Economist estimates that the AI developers’ three-month revenue growth slowed from 80 to 90 percent in the spring to 12 percent in October, although not every indicator agrees. I personally find my token usage has fallen over the last few months as models have become more efficient and I am now considering cancelling one or even two of my four Claude Ultra plans.
If it is a bubble that bursts then by how much will the market fall? Table 2 considers several ways of sizing the fall in the market as a whole, measured from where it closed on November 13, about 3 percent below its record high on August 13.
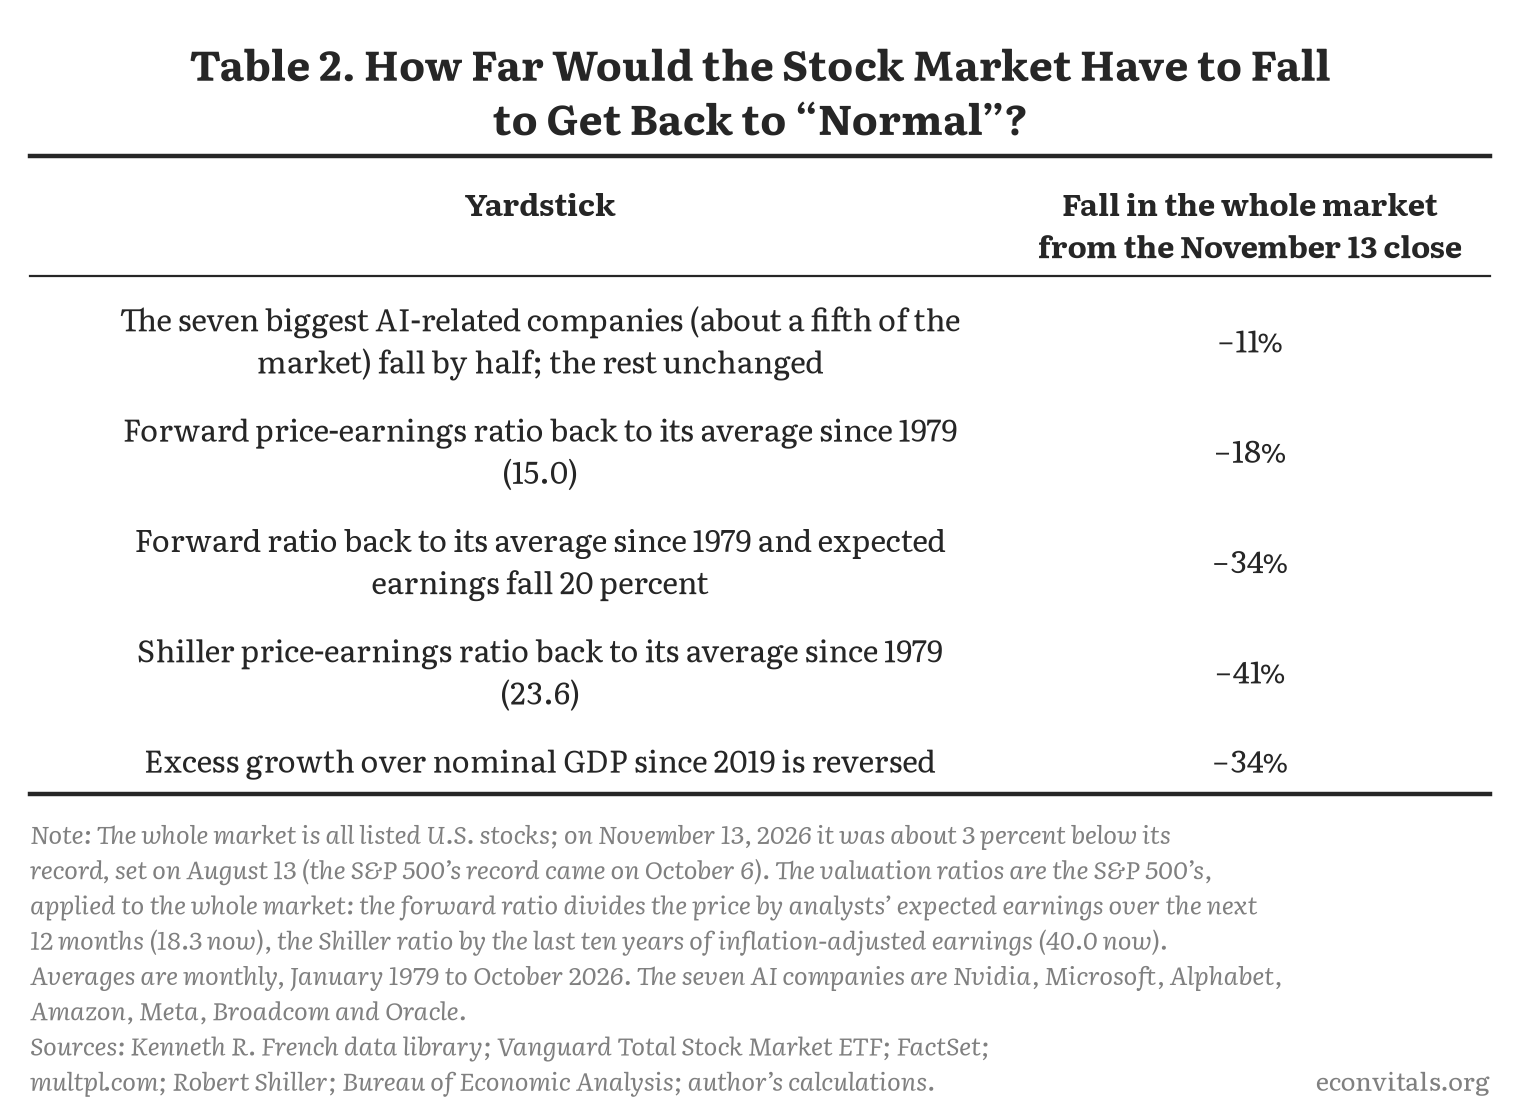
If Nvidia, Microsoft, Alphabet, Amazon, Meta, Broadcom and Oracle all fall by 50 percent then the market as a whole would fall by 11 percent. On the one hand, a 50 percent decline is very large for many of those companies because they are large, established companies with substantial profit flows unrelated to AI. On the other hand, if they fell it is likely other AI-related stocks and even other unrelated stocks would fall too—although it is possible there would be a countervailing increase in software stocks, which have fallen 14 percent since their peak in September 2025 on fears that AI would replace them.
To look at the broader market, one thought experiment is that the forward price-earnings ratio falls from its current value of 18.3 to its average since 1979, 15.0. That would mean an 18 percent decline in the market. If that reset was accompanied by 20 percent lower expected earnings, that would be a 34 percent decline in the market.
If the Shiller CAPE returned to its average since 1979, 23.6, that would be a 41 percent decline in the market. Finally, if the excess growth of the stock market over nominal GDP since 2019 was reversed, that would be a 34 percent decline in the market. Note this is similar to assuming a counterfactual in which the stock market had normal returns over the last seven years—nominal GDP has grown at a 6.2 percent annual rate since 2019—a bit below the roughly 7 percent a year that stock prices have grown over the long run.
Would these yardsticks have worked in the dot-com bubble?
How would these methodologies have worked in predicting the magnitude of the dot-com decline? It is tempting to ask what they would have predicted about the magnitude of the decline on March 24, 2000 (the S&P 500’s peak). But that analysis assumes you already know the date the bubble will burst, something that is only clear in hindsight. If earnings and stock prices continue to rise before the bubble bursts then the trough, measured from today, could be much less of a fall than using today’s metrics would imply. To that end, I also apply this analysis to a “placebo” date, which I choose as December 5, 1996, when Federal Reserve Chairman Alan Greenspan gave his famous “irrational exuberance” speech.
Table 3 runs the same yardsticks on those two dates and compares them with what actually happened.
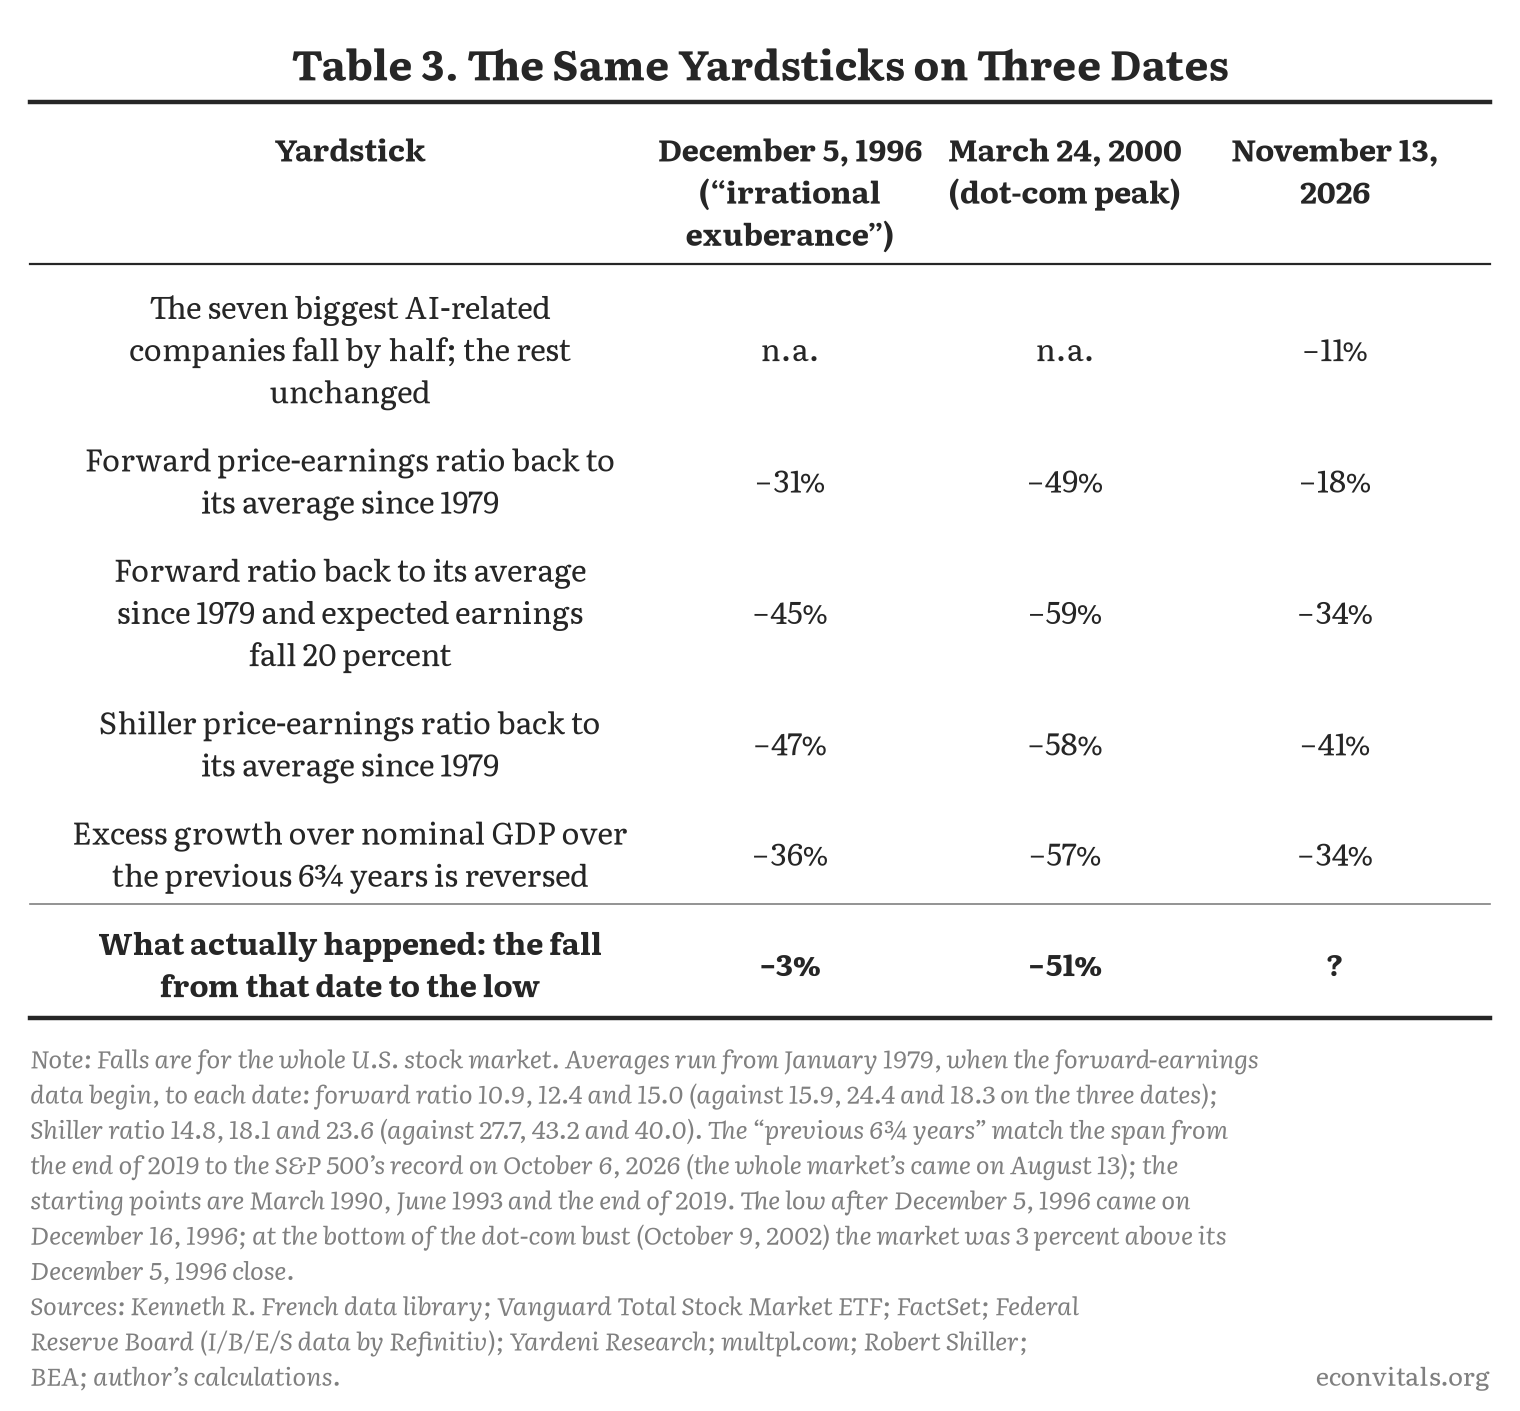
This analysis suggests that if we are at the peak of the bubble today, then the metrics are reasonable. They basically called the magnitude of the dot-com bust correctly: the actual fall, 51 percent, was near the mild end of their range of 49 to 59 percent. That leads me to think that if we’re at the peak now (or just below it, since prices are already down a little), then the 18 to 41 percent range is reasonable—and that one should shade that down, not up.
But we do not know we are at a peak, and the 1996 test suggests that, judged in advance, this analysis could be hopeless—massively overstating future stock losses if earnings grow more before the potential bubble deflates.
What options markets say
Finally, another way to estimate the probability of stock market declines is by looking at the pricing of options on declines in the S&P 500. Table 4 shows these for options that expire in December 2027.
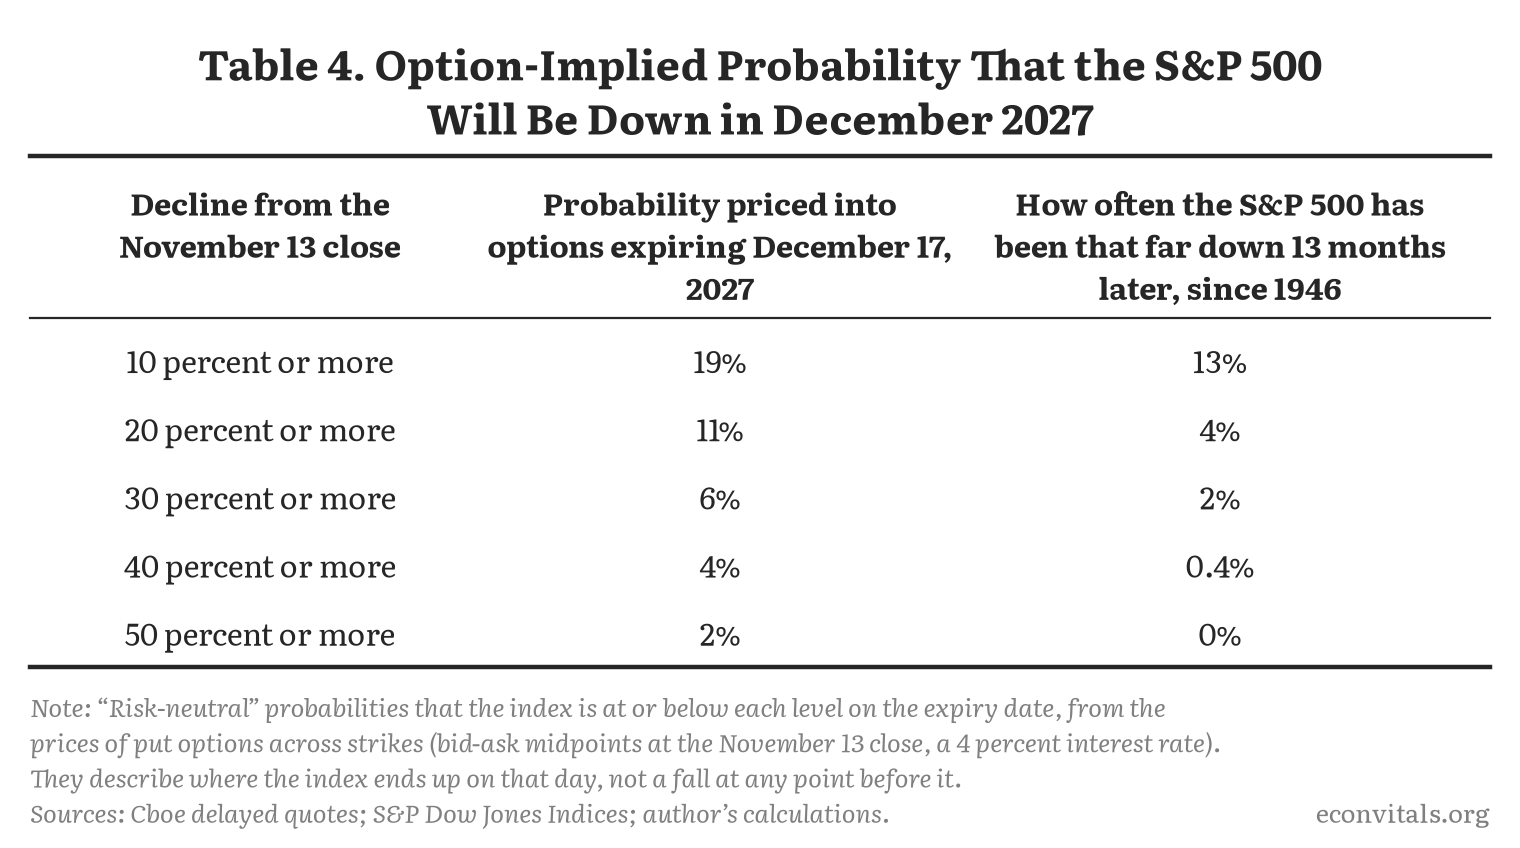
These are the chances that the index ends up at least that far down on the day the options expire, not that it falls that far at some point along the way. By that measure, options put the chance of the S&P 500 being 20 percent or more lower in December 2027 at 11 percent, and the chance of its being down by half at 2 percent. The chances of declines this large at some point before then, including ones followed by some recovery, are higher.
Figure 4 shows the history of a closely related measure since 2007, from the Federal Reserve Bank of Minneapolis: the chance options put on the S&P 500 being 20 percent lower a year later. The pricing of that risk is near the low end of its range: at 8.5 percent at the end of October, it was lower than in 86 percent of the weeks since the series began in 2007. (That is a bit below the 11 percent in Table 4 because it covers 12 months rather than 13 and was measured before stocks fell in early November.)
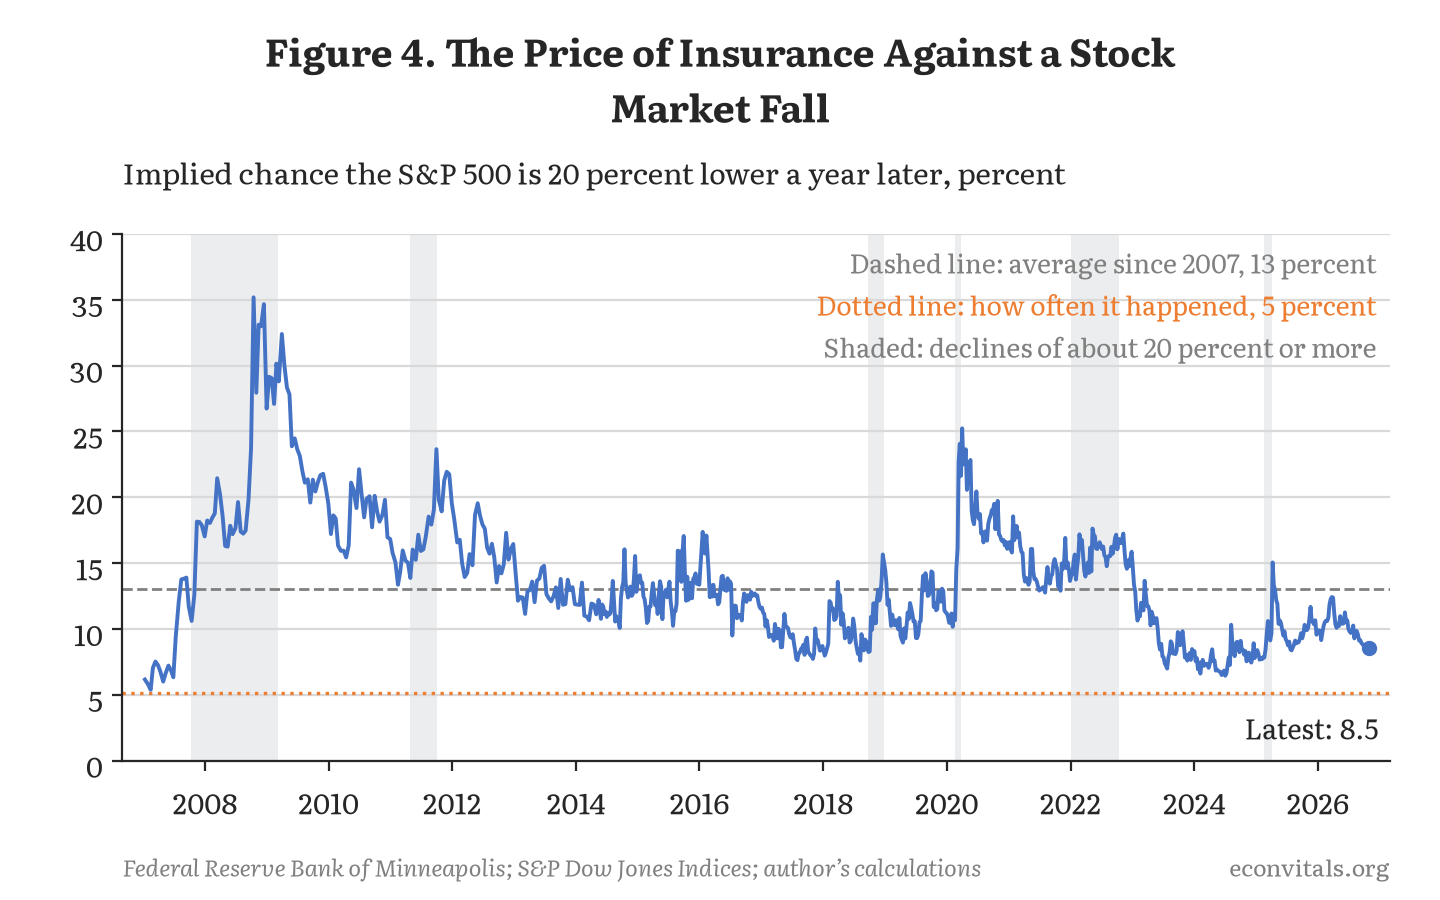
This history also shows that in one sense even an implied 8.5 percent chance that the market will be down 20 percent a year later is too high. Investors are paying for insurance and so willing to lose in expected value for securities that pay off in bad times. That is why since 2007 options have priced the chance that the S&P 500 would be 20 percent lower a year later at 13 percent on average, while that actually happened about 5 percent of the time.
That said, if you think the market is irrationally overpriced then these contracts are too. Historically options pricing has not been particularly prescient. It turns out it has been more of a coincident than a leading indicator, only sounding a warning once a decline is under way. In fact, it was below average in October 2007, February 2020 and February 2025—all just before large market declines.
Bottom line: a baseline of 25 percent
Based on all of this—and if one is willing to ignore actual market pricing of the level and risk of market changes—a reasonable baseline for the “if it is a bubble and it bursts” case is a 25 percent decline. I would consider a bad case to be a 35 percent decline in the broader market. A severe—and highly unlikely—case is 50 percent.
Even the baseline case would be a big hit to household wealth: a 25 percent fall would wipe out about $19 trillion of the stock that households own directly and through mutual funds and retirement accounts. Whether that would cause a recession—through consumers cutting back, and through the financial system—is the subject of my next posts.
Note: A partial replication package is available on Econvitals: the code for every figure and table and the public data behind them. The licensed data are described there but not included.
Jason’s Occasional Posts are written by Jason himself; almost everything else on Econvitals is written by Claude. Subscribe to get them by email, or read the others.