The AI Boom’s Two Engines
Econvitals just added a Macroeconomic Simulator that lets you use the Federal Reserve’s FRB/US model to simulate policies like Fed rate hikes and tax cuts, as well as shocks like an oil price spike or a fall in stock prices. Much of this post uses the same model to do a “what if” analysis of the data center buildout. The full analysis, along with many more “what if” counterfactuals for economic events from the financial crisis to the present, is on my personal webpage.
The data center buildout is set to be among the largest investment expansions in peacetime American history. How different is our economy today because of it? The answer, based on a simulation using the large-scale macroeconomic model used by the Federal Reserve (FRB/US), is not much. The buildout by itself has raised GDP by only about 0.3 percent, because most of the investment is imported, and imports do not add to U.S. GDP or lower the unemployment rate. The stock market boom that came with it matters more—together they have raised GDP by about 0.6 percent and lowered the unemployment rate by about 0.3 percentage point. If the stock market gains go away, they could take much of that growth with them.
To date, the AI boom has shown up in a large and clear manner on the demand side of the economy, through both the AI buildout itself and the associated stock market boom—which in turn is fueling demand. I believe we are also beginning to see a small increase in supply due to the higher productivity associated with AI. If you squint, you can see signs of it, but they are debatable and not large, and they are not included in this analysis—nor are any direct productivity benefits of the capital spending on the AI buildout.
These demand shocks are hitting an economy that was already at what the Federal Reserve considers full employment, with inflation above the Fed’s target. Some of the extra demand can bleed through to the overall economy, but in a situation like this, effectively managed monetary policy will try to make sure that not too much of it does—so interest rates go up, which creates a headwind for interest-sensitive investment in areas like housing, and some of it shows up as output temporarily exceeding potential.
The table below summarizes the main results of the simulations. I should say at the outset that this is just one model, not the definitive truth. A full answer to this question should be based on multiple ways of approaching the problem. But at least the Fed’s model is internally consistent and plausible, a big improvement over many of the other answers floating around in the discussion.
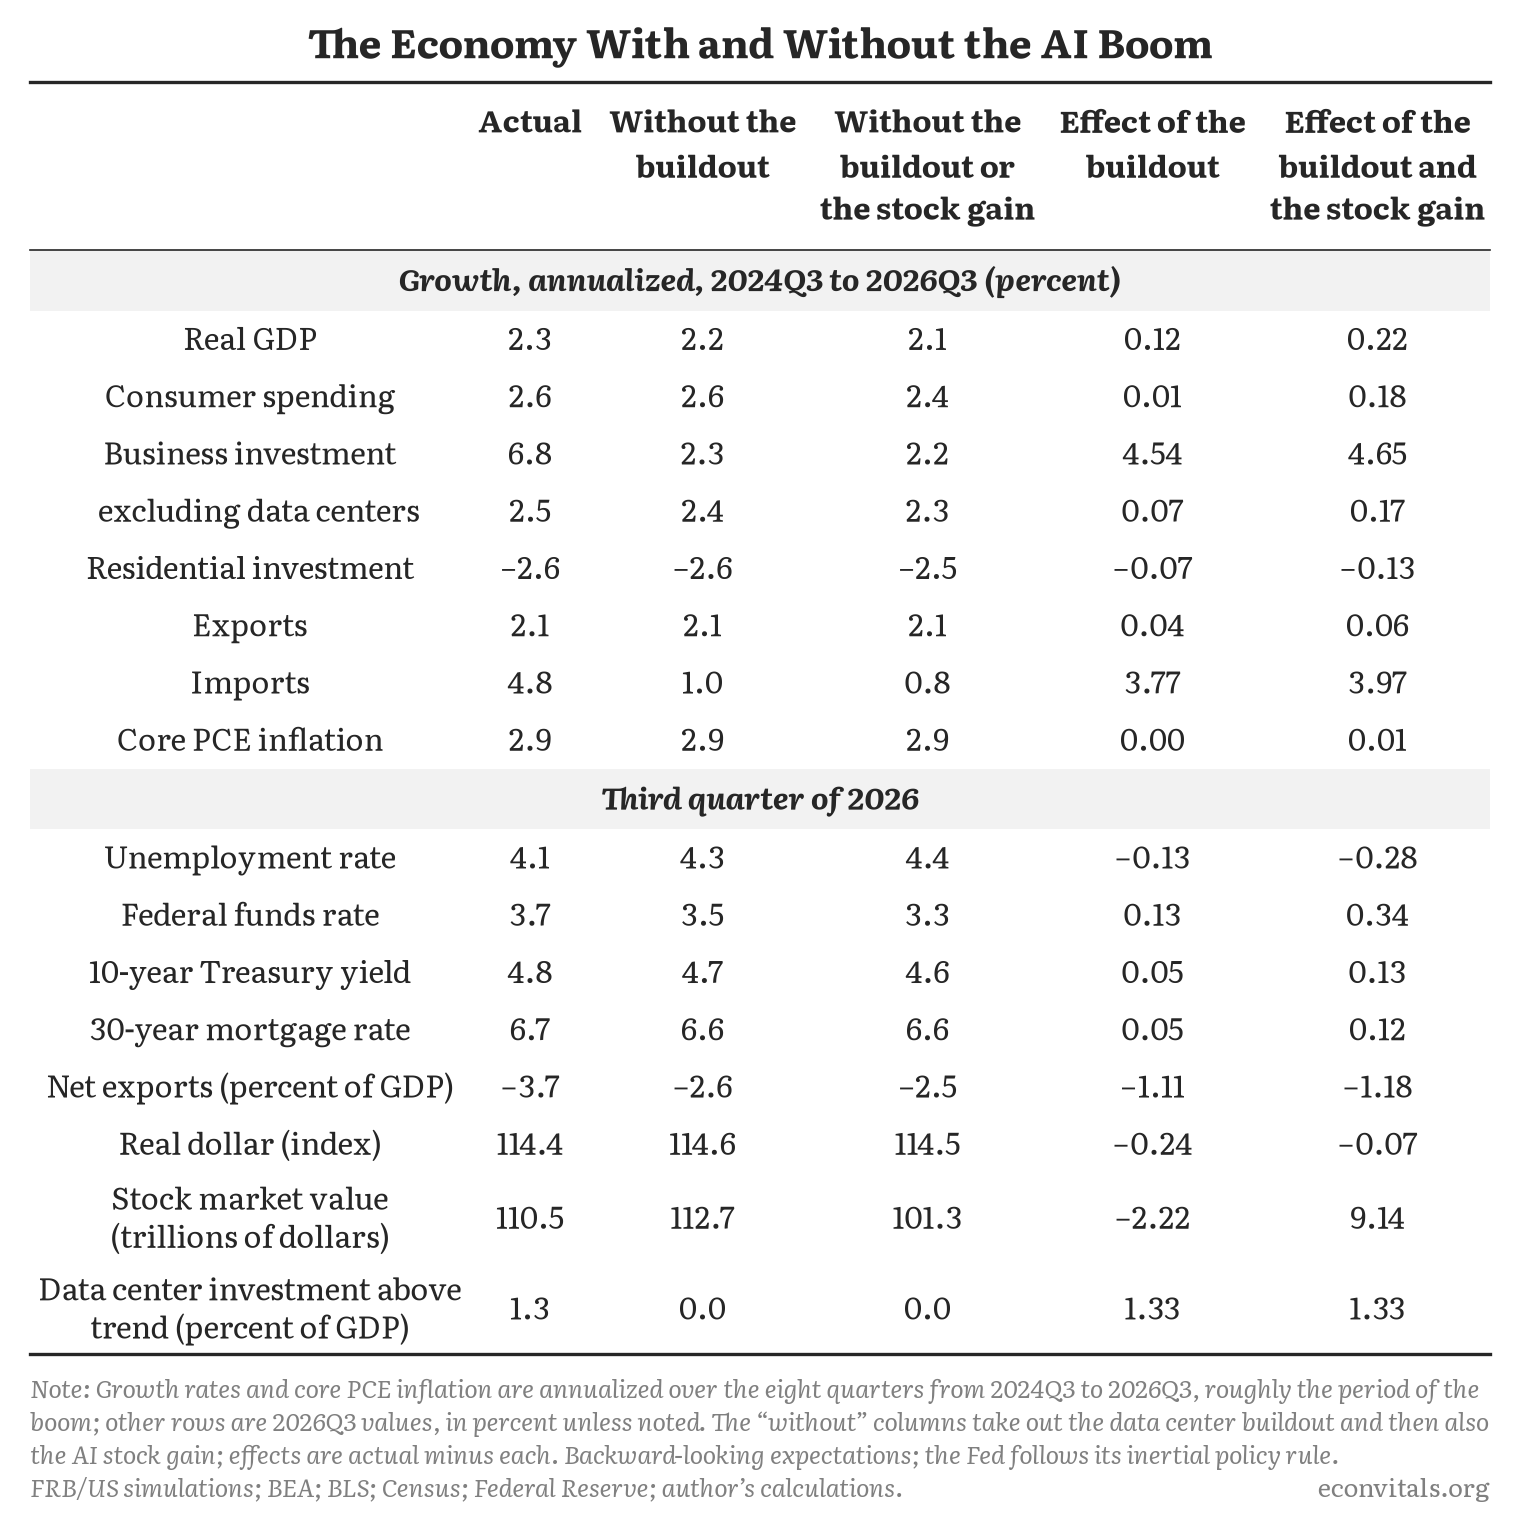
The Fed’s macroeconomic model is basically symmetric, so if the data center boom ends and the AI stock gains disappear, the result would be roughly the negative of this, only faster—shaving about half a percentage point off growth next year and a quarter point the year after, but nothing resembling a recession. Toward the end of this post I’ll come back to the question of whether or not that is the correct prediction.
A historic buildout, and a stock market boom to match
A recent paper by Stijn Van Nieuwerburgh estimated that the data center buildout will be even bigger than the most historic capital expenditure booms, like building the railroads or the telecom and fiber buildout of the late 1990s:
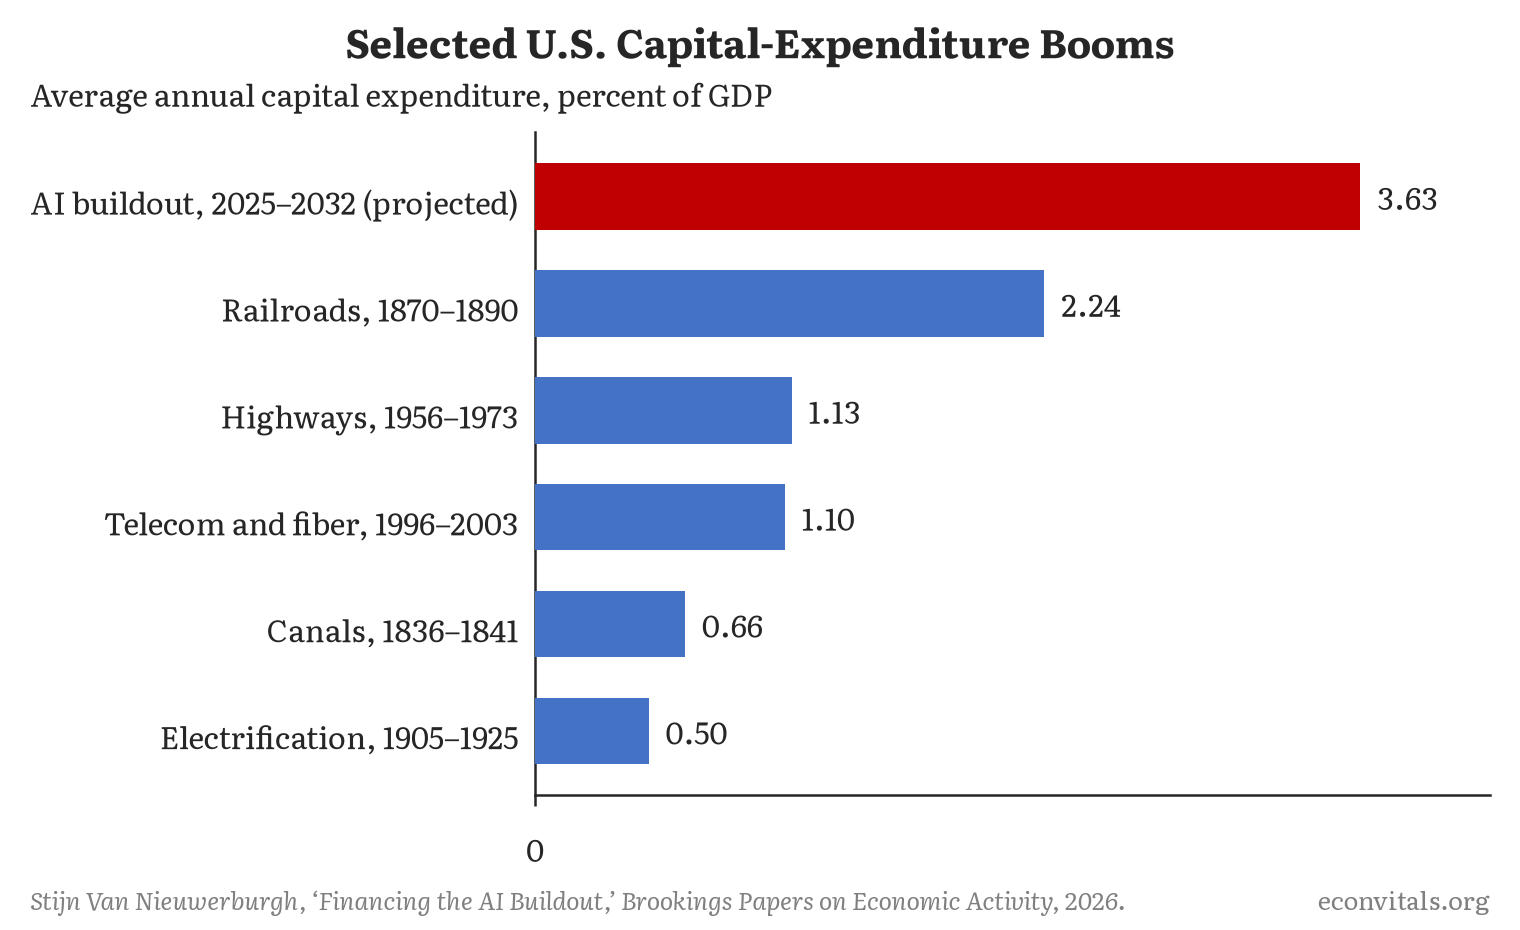
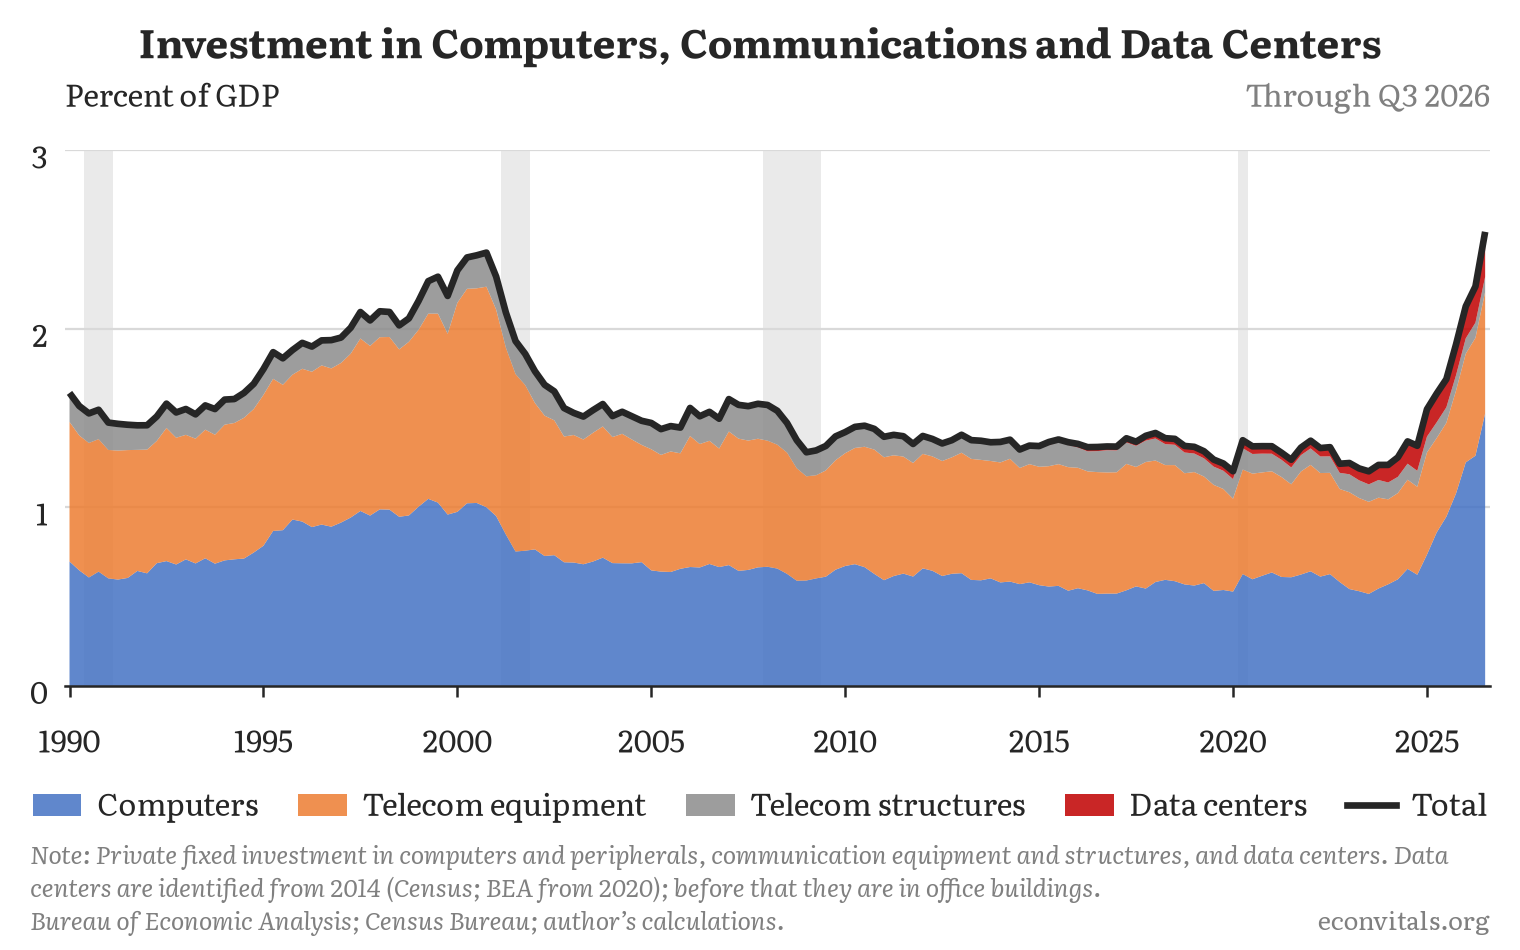
Already the buildout of data centers and the computers and communications equipment that fill them—about 2½ percent of GDP, or roughly $840 billion a year—has surpassed what we saw during the telecom and fiber buildout, and analyst forecasts for future buildout keep rising and rising (although we will see if recent events change that).
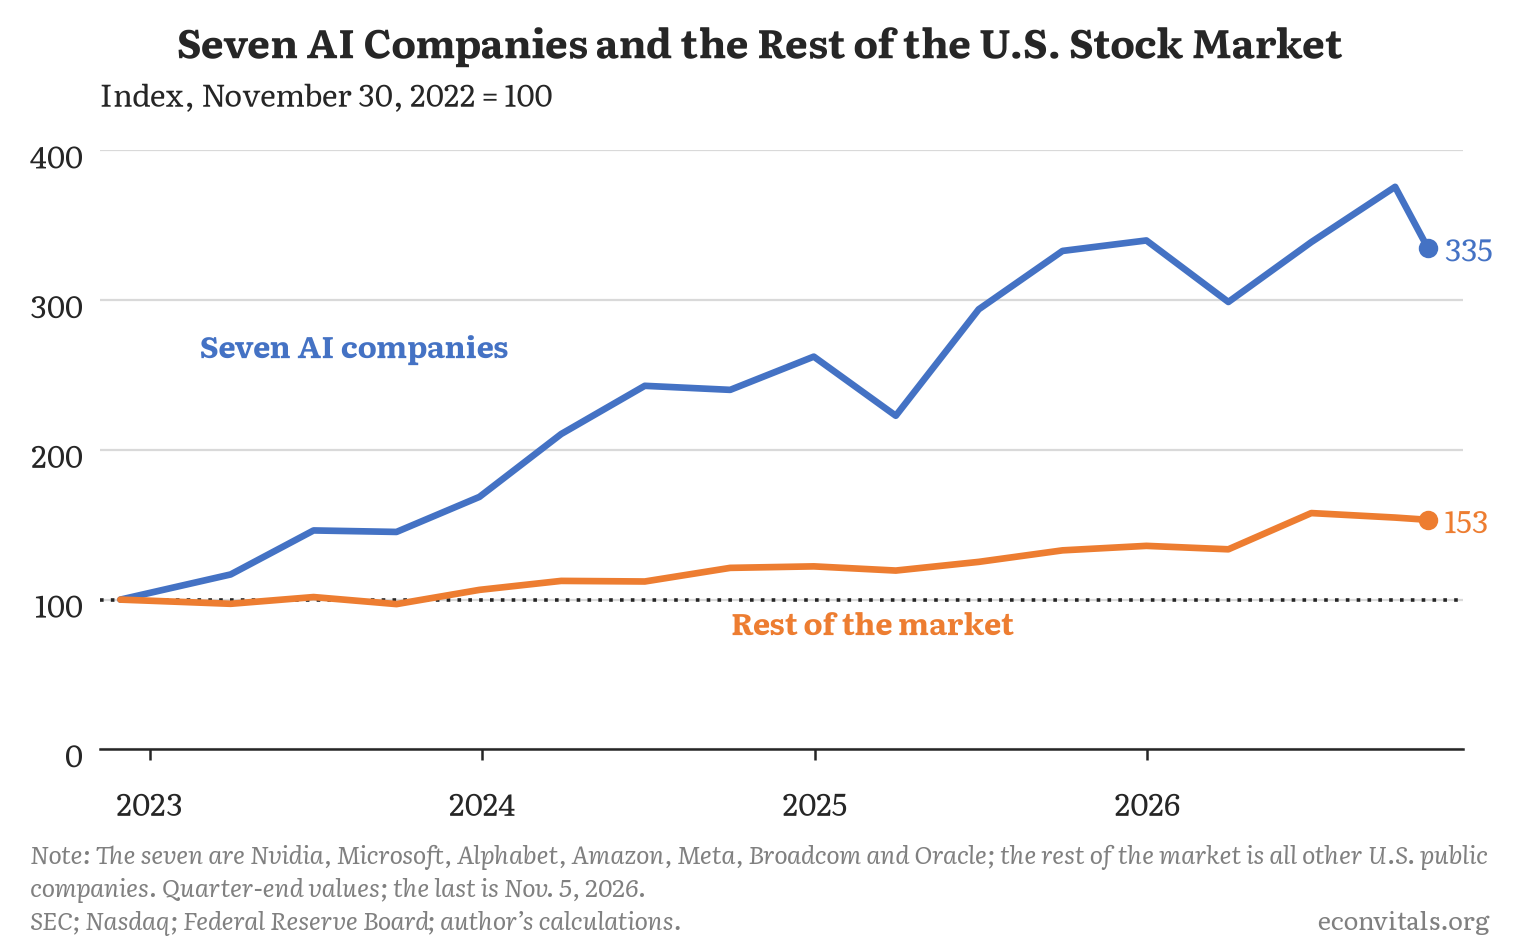
And, of course, the stock market has boomed—and a disproportionate share of that boom is in AI buildout stocks: just seven companies account for about two-fifths of the increase in the value of U.S. public companies since ChatGPT launched, with their value more than tripling while the rest of the market rose by about half.
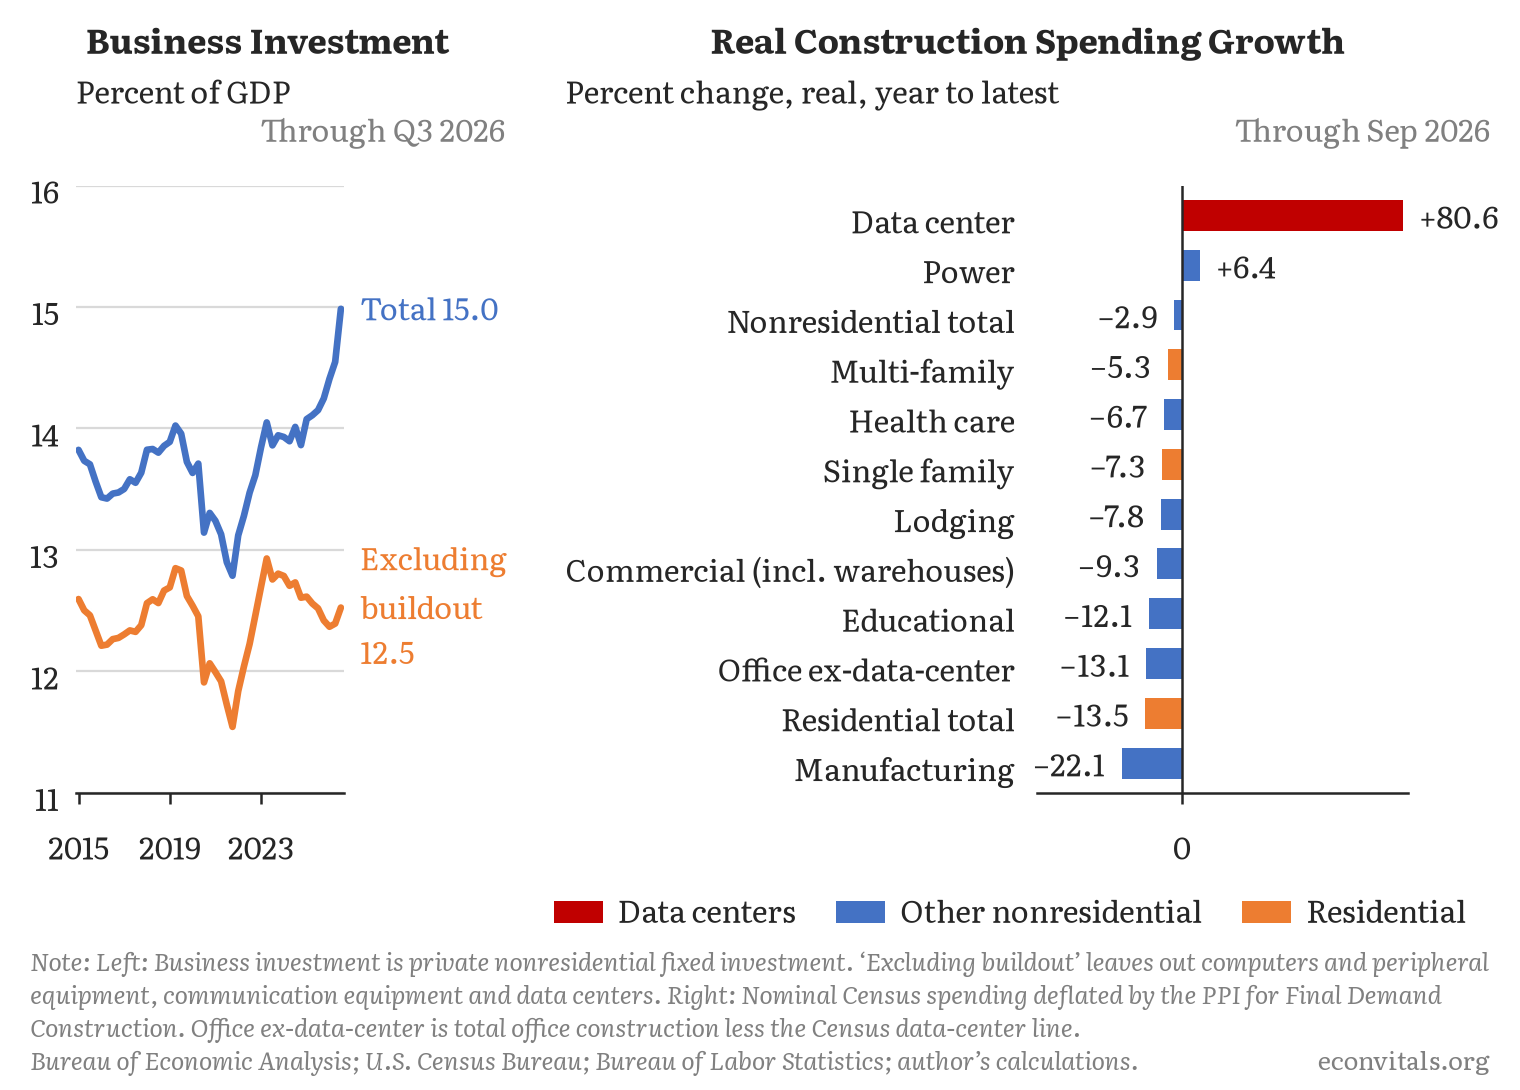
A few other facts about the economy worth noting: business investment has risen as a share of GDP to its highest level since 1982. Excluding computers, communications equipment and data centers, private investment has actually fallen, from 16.8 percent of GDP in 2023–24 to 16.1 percent. And construction outside of data centers is falling almost across the board: over the past year, adjusted for construction costs, spending on nonresidential construction other than data centers and power is down 13 percent, led by factories (down 22 percent), offices (13 percent) and warehouses (13 percent). The main exception is power (including oil and gas), up 6 percent, likely some of it to serve data centers.
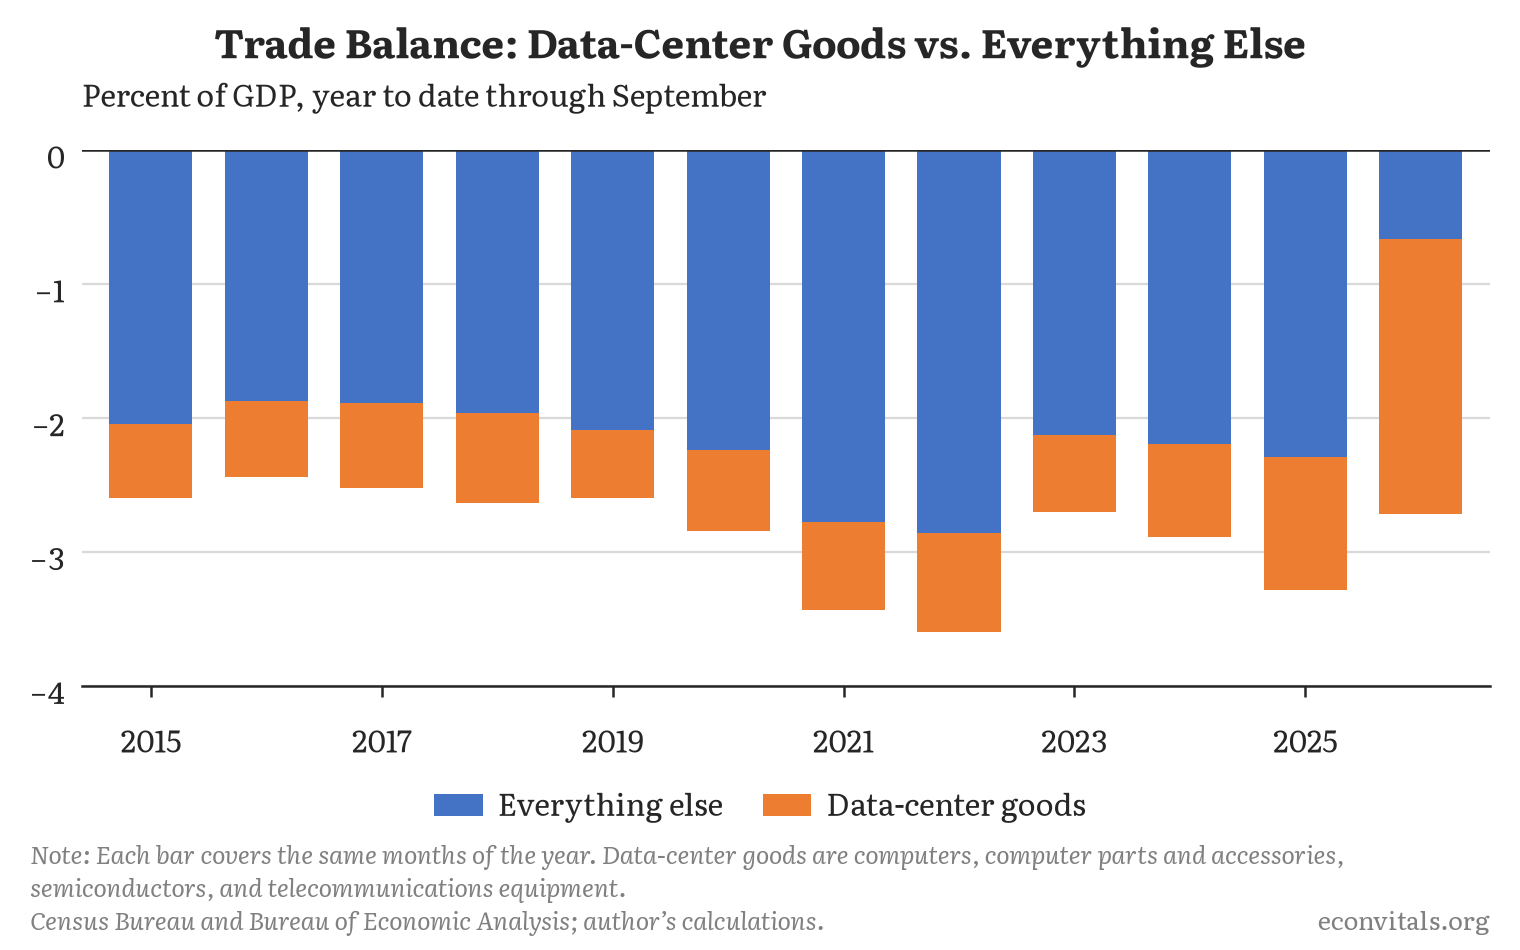
Much of this investment has come from abroad. While the overall trade balance has been roughly unchanged, the portion due to the AI buildout has surged while the rest has shrunk.
The impact of the buildout on GDP has been limited by how much of it is imported
To get a plausible quantification of how the boom has changed the economy, I will use the Federal Reserve’s large-scale macroeconomic model, FRB/US, which the Fed helpfully provides to the public in Python code—something I worked with interactively using Claude Code. FRB/US is the model the Fed’s staff has used for forecasting and policy analysis since 1996. It has 284 equations, with about 60 of them estimated from decades of data, covering households, businesses, government, trade and financial markets. The model is not truth, and over time more perspectives and evidence will help improve our understanding. But it’s a pretty good baseline to start from.
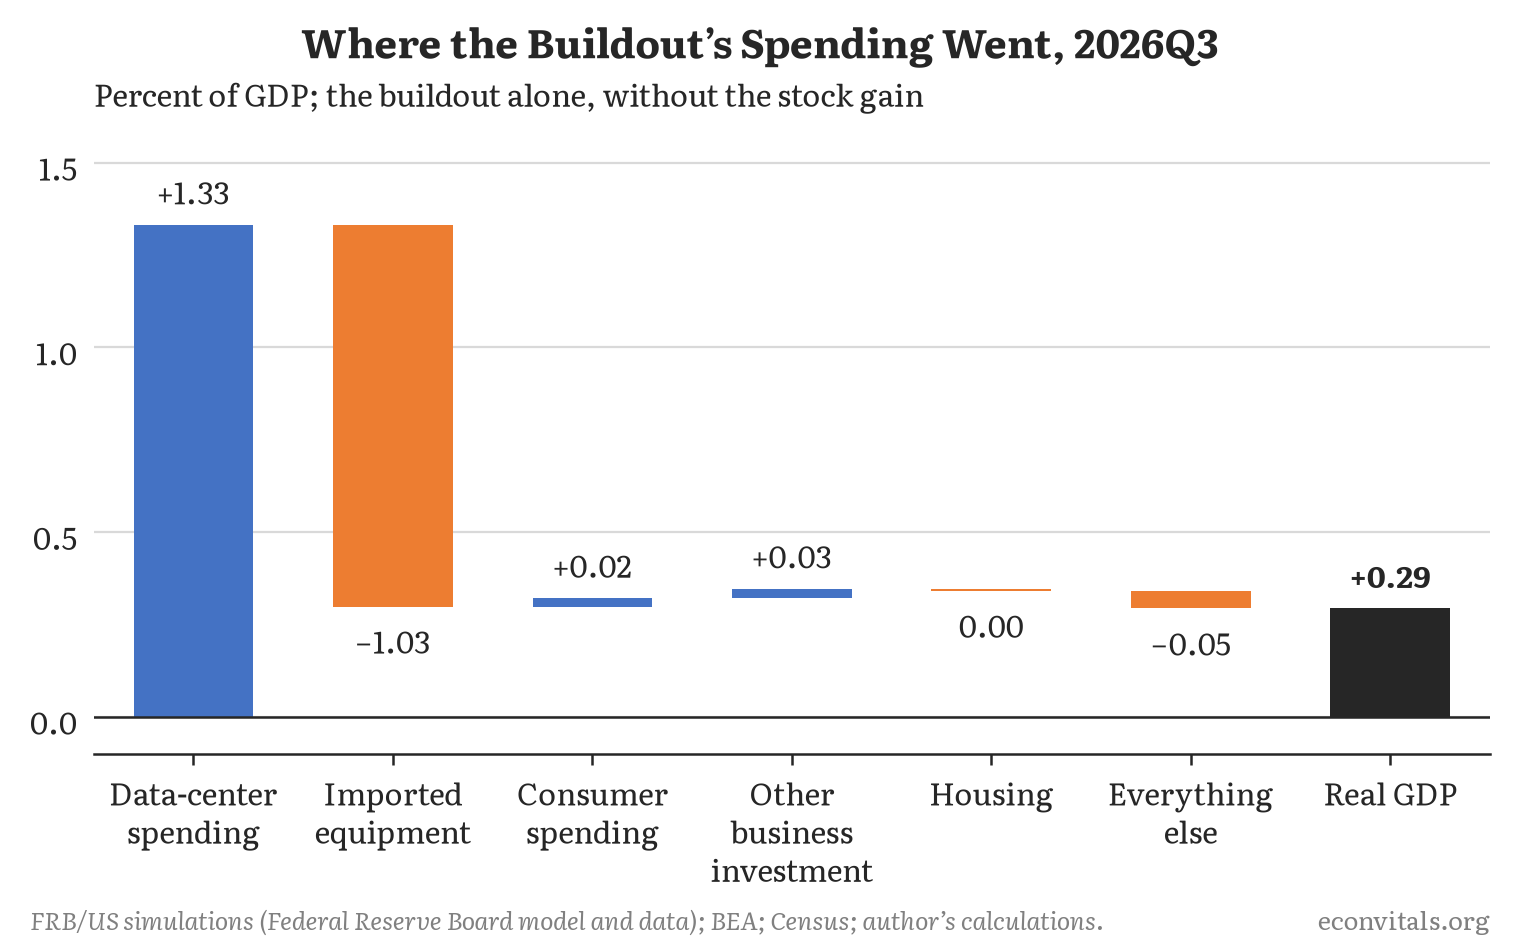
The first step in this simulation is to take the economy and shock it with the increase in investment in data centers—spending on computers, communication equipment and data center construction above its 2015–2022 trend—which started in mid-2024 and ramped up to 1.3 percent of GDP by the third quarter of 2026. I assume 75 percent of it is imported (closer to 90 percent for computers and 80 percent for communication equipment, but only about 10 percent for construction), and the rest is domestically produced investment. The trade data suggests the import share could be even higher, which would make the effect smaller still. For now I will not incorporate the stronger stock market—that is covered in the next section. All of the simulations assume the Fed follows the inertial policy rule that is the default in the public model, responding to the output gap and inflation, and that these changes plus other sources of changes in long-term interest rates affect interest-rate-sensitive sectors of the economy. People update their expectations based on patterns in the data rather than anticipating where the economy is headed from observations like seeing the potential capabilities of AI. (You can change any of these assumptions on the website.)
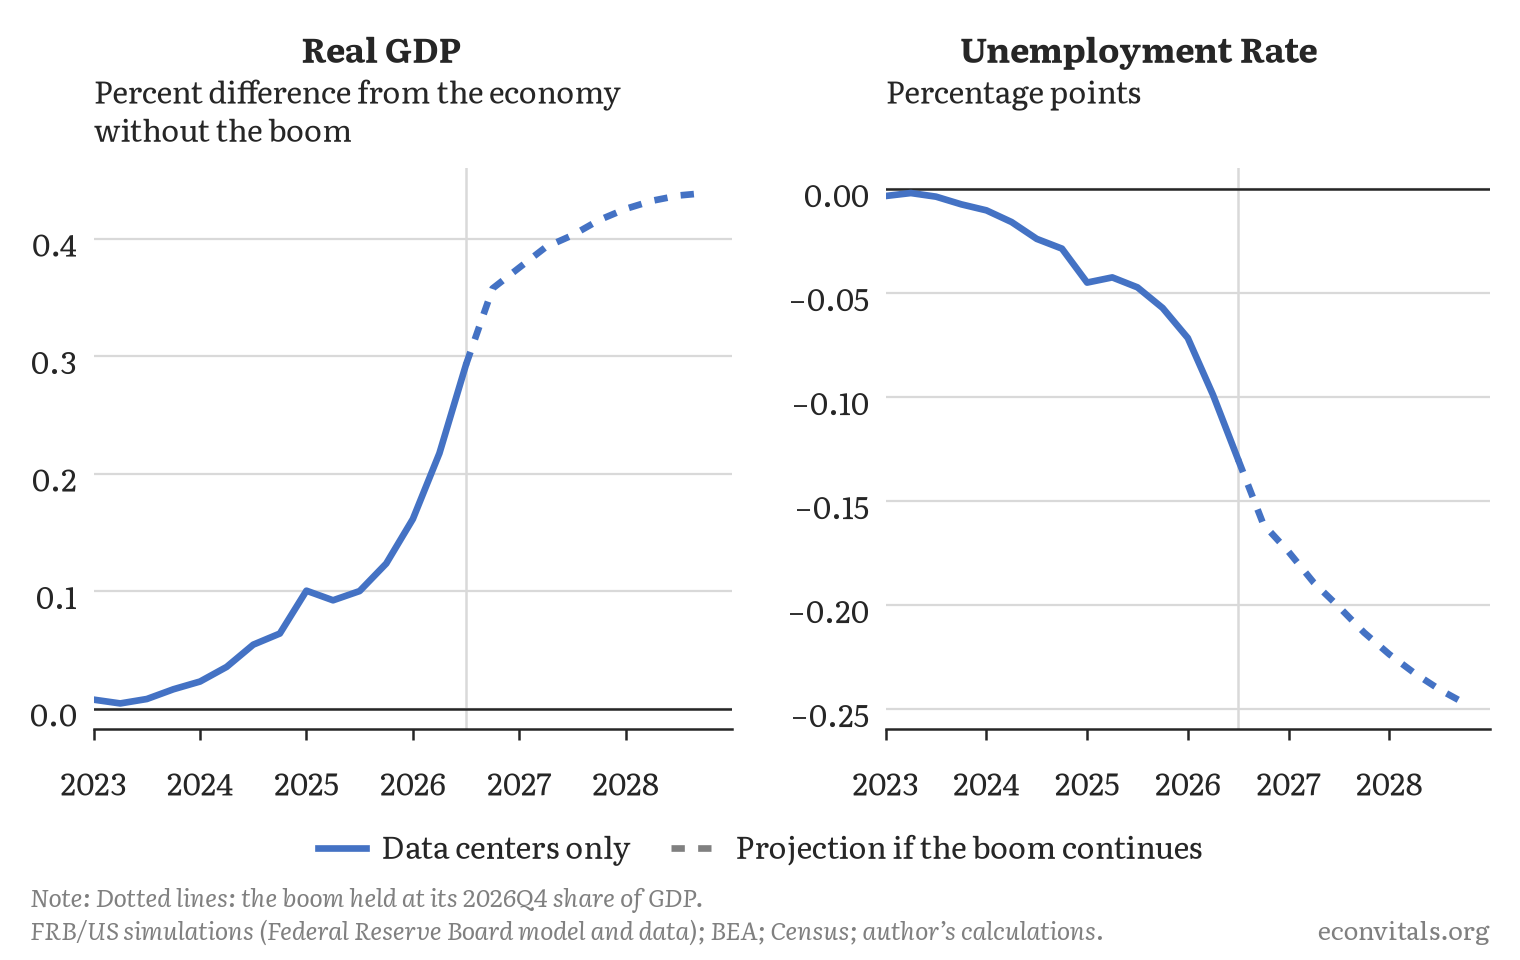
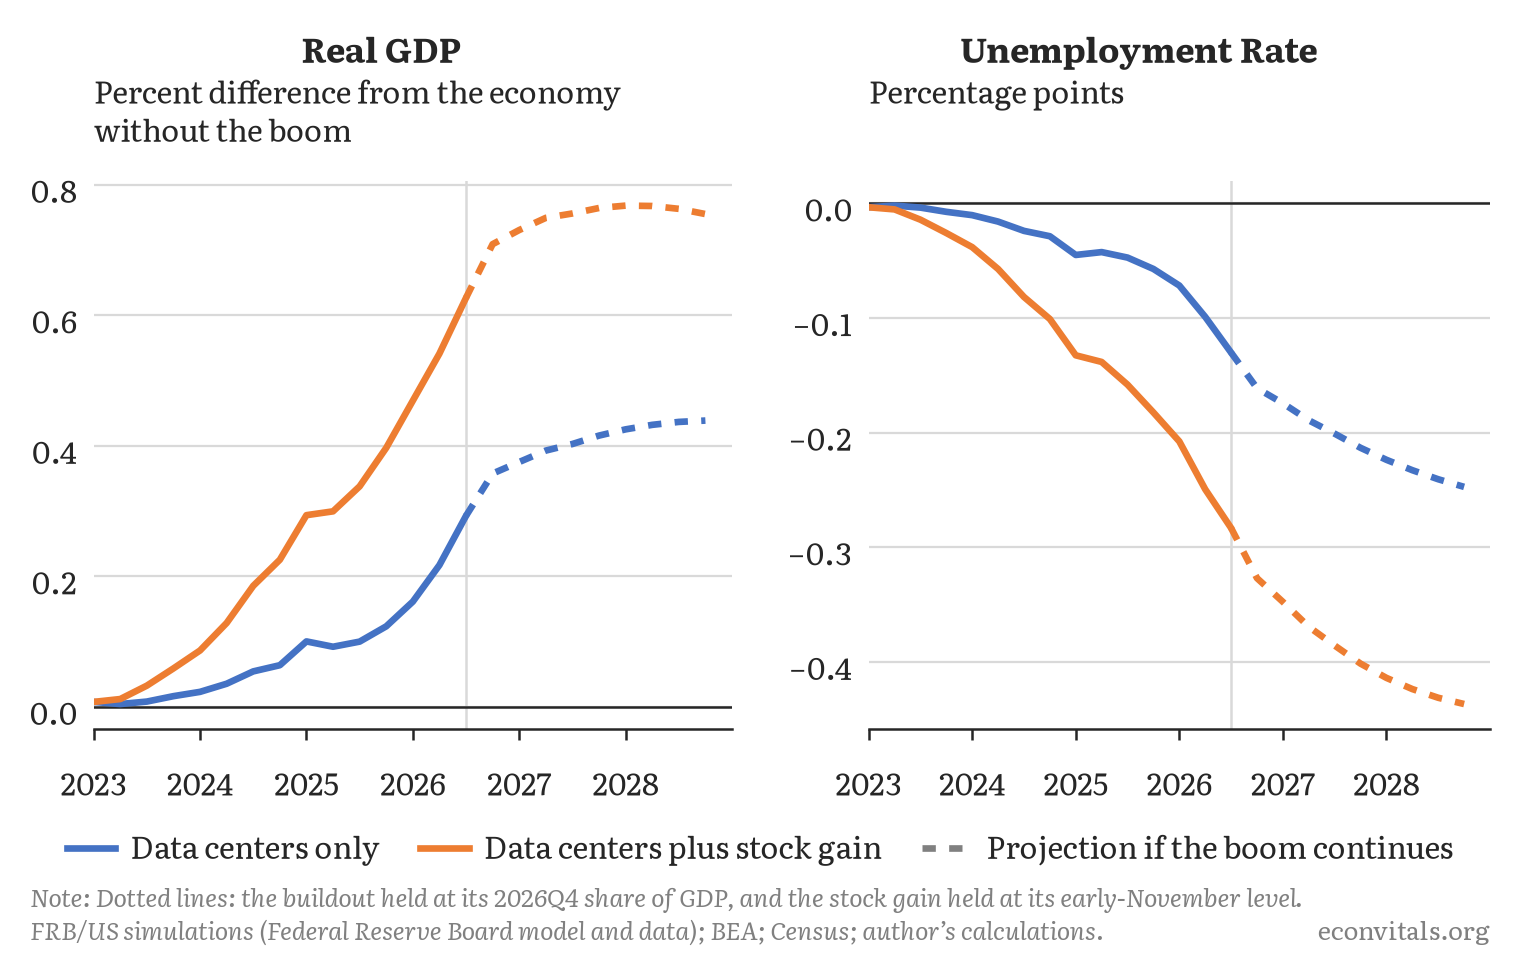
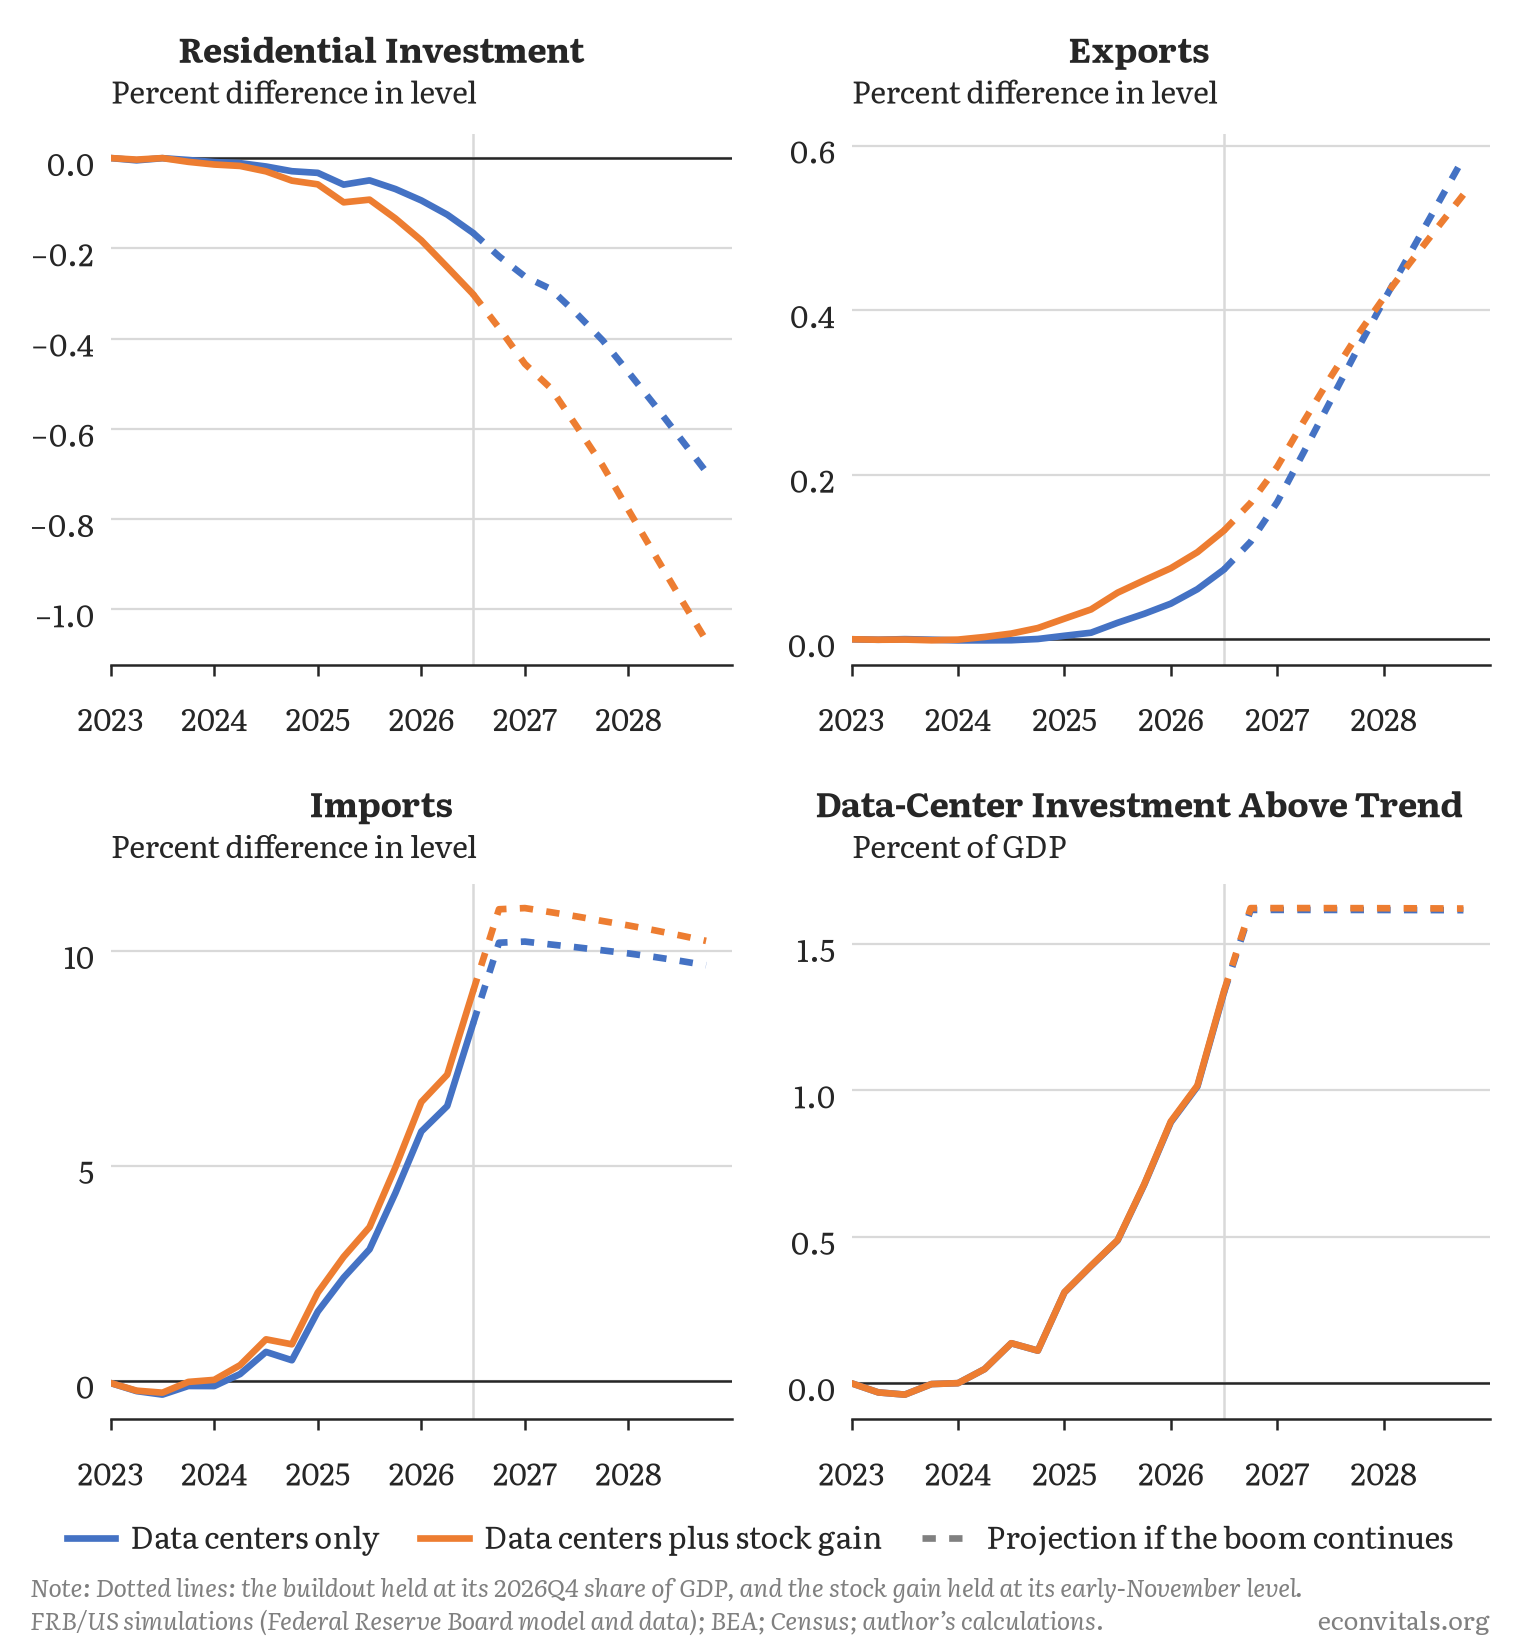
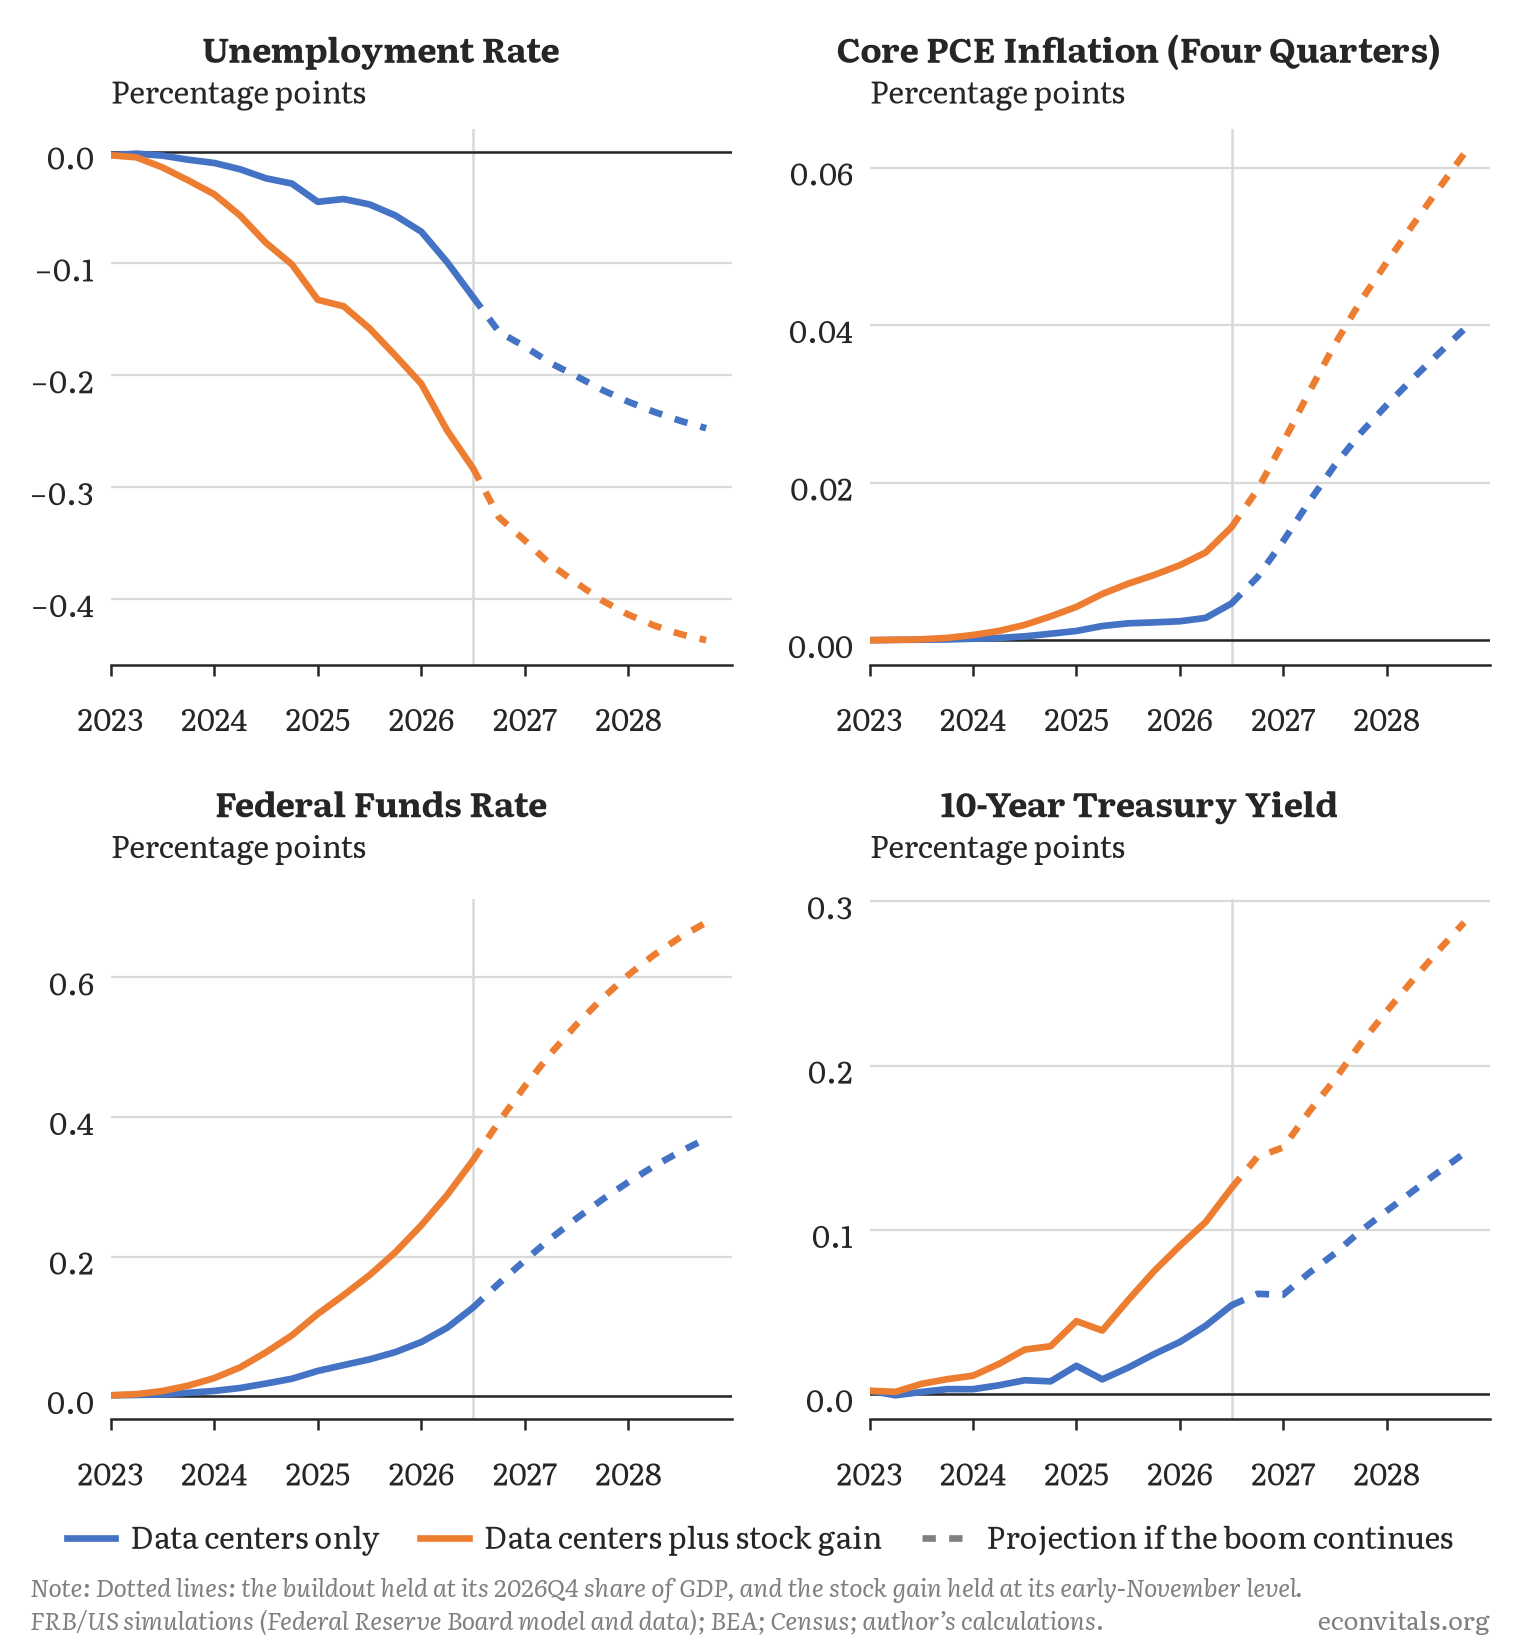
The short answer is that the data center boom by itself has lifted GDP a little and lowered the unemployment rate a little—but neither effect was that large. By the third quarter of 2026, GDP is about 0.3 percent higher than it would have been, and the unemployment rate about 0.1 percentage point lower. If the data center boom continues at the 1.6 percent of GDP it is on track to reach by the end of this year, these effects would build a bit further and then level off, with GDP about 0.45 percent higher and the unemployment rate about 0.25 percentage point lower by the end of 2028 (the dotted lines). If it keeps growing—say, by another half a percent of GDP a year—the effects by the end of 2028 would be larger: about 0.7 percent on GDP and 0.35 percentage point on unemployment. A fuller set of results is in the appendix.
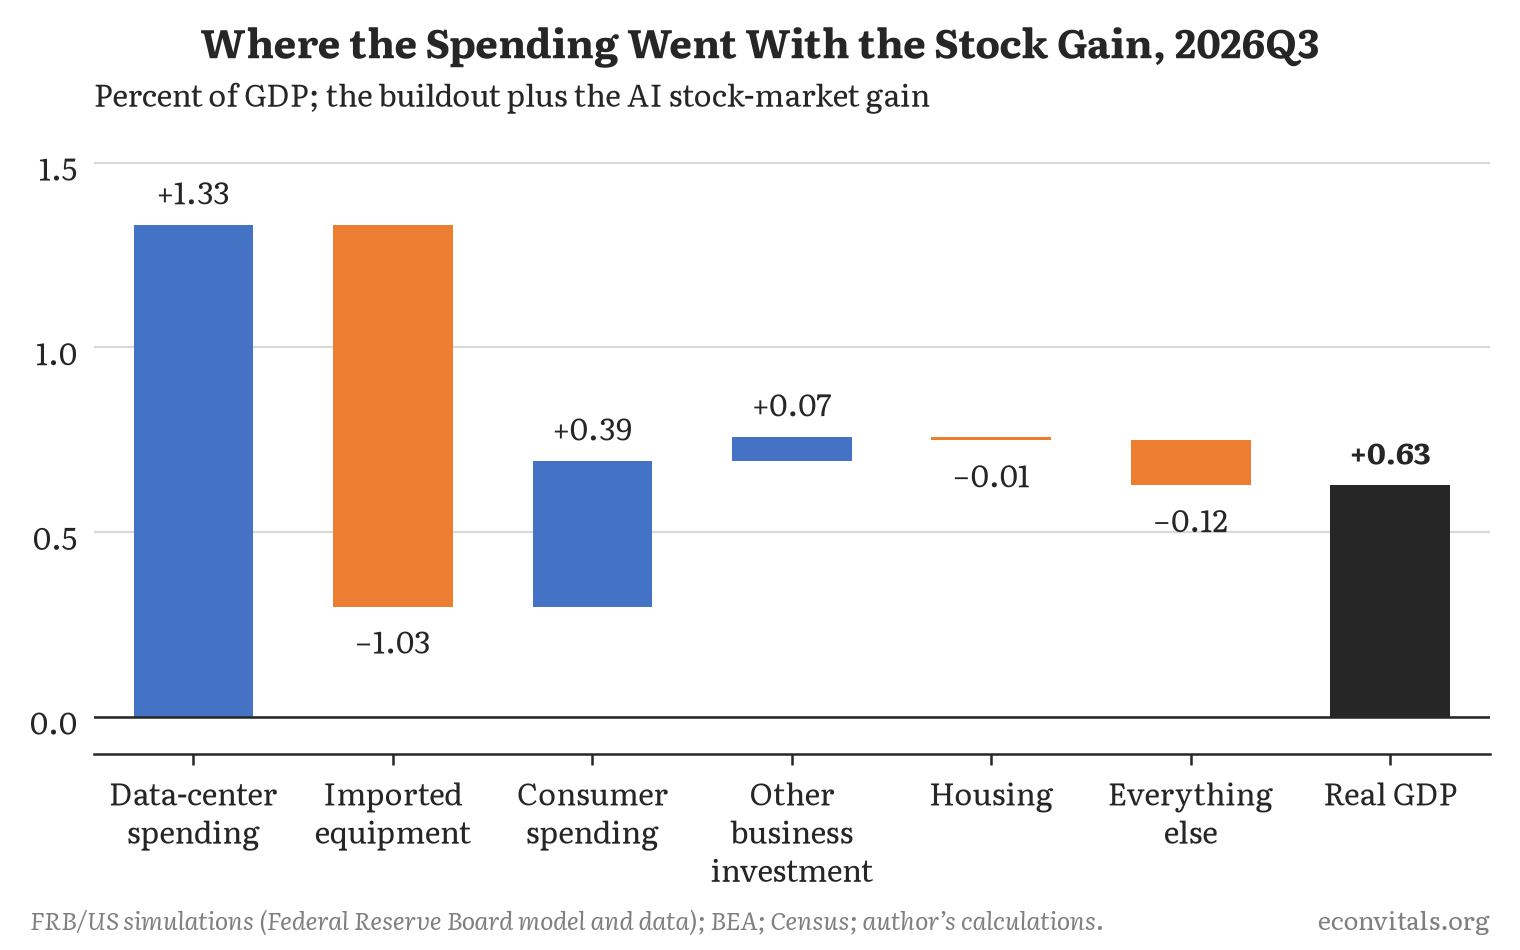
The effect on GDP has been much more muted than the direct spending. The reason is almost entirely imports. Data center spending above trend reached 1.3 percent of GDP, but about 1 percentage point of that was imported equipment. Imports matter because they do not directly enter GDP: imported equipment shows up as positive investment and as negative imports, which cancel out.
Crowding out of other spending barely shows up: because most of the spending leaks abroad, the Fed’s rule raises rates only about a tenth of a percentage point, so housing is a touch lower while the extra income slightly raises consumer spending and other business investment. That is not to say there is no crowding out: residential investment is below its trajectory, and if the buildout continues that gap will grow. It’s just that the change is not large enough—especially since residential investment is only about 3½ percent of GDP—to lower overall GDP by much.
The stock market boom is even more important than the buildout itself
The stock market boom associated with the data center buildout is a bigger deal. The stocks of seven AI-related companies (Nvidia, Microsoft, Alphabet, Amazon, Meta, Broadcom and Oracle) are up about $11 trillion more than they would have been had they kept pace with the rest of the market since ChatGPT came out, and American households own about $7.6 trillion of that. If 3 percent of that is spent (a plausible estimate of the wealth effect), that would be about $230 billion in higher consumer spending, or 0.7 percent of GDP. A big deal. (These numbers are as of September 30, matching the focus on the economy through the third quarter; measured through November 5, the gain is only about $9 trillion.)
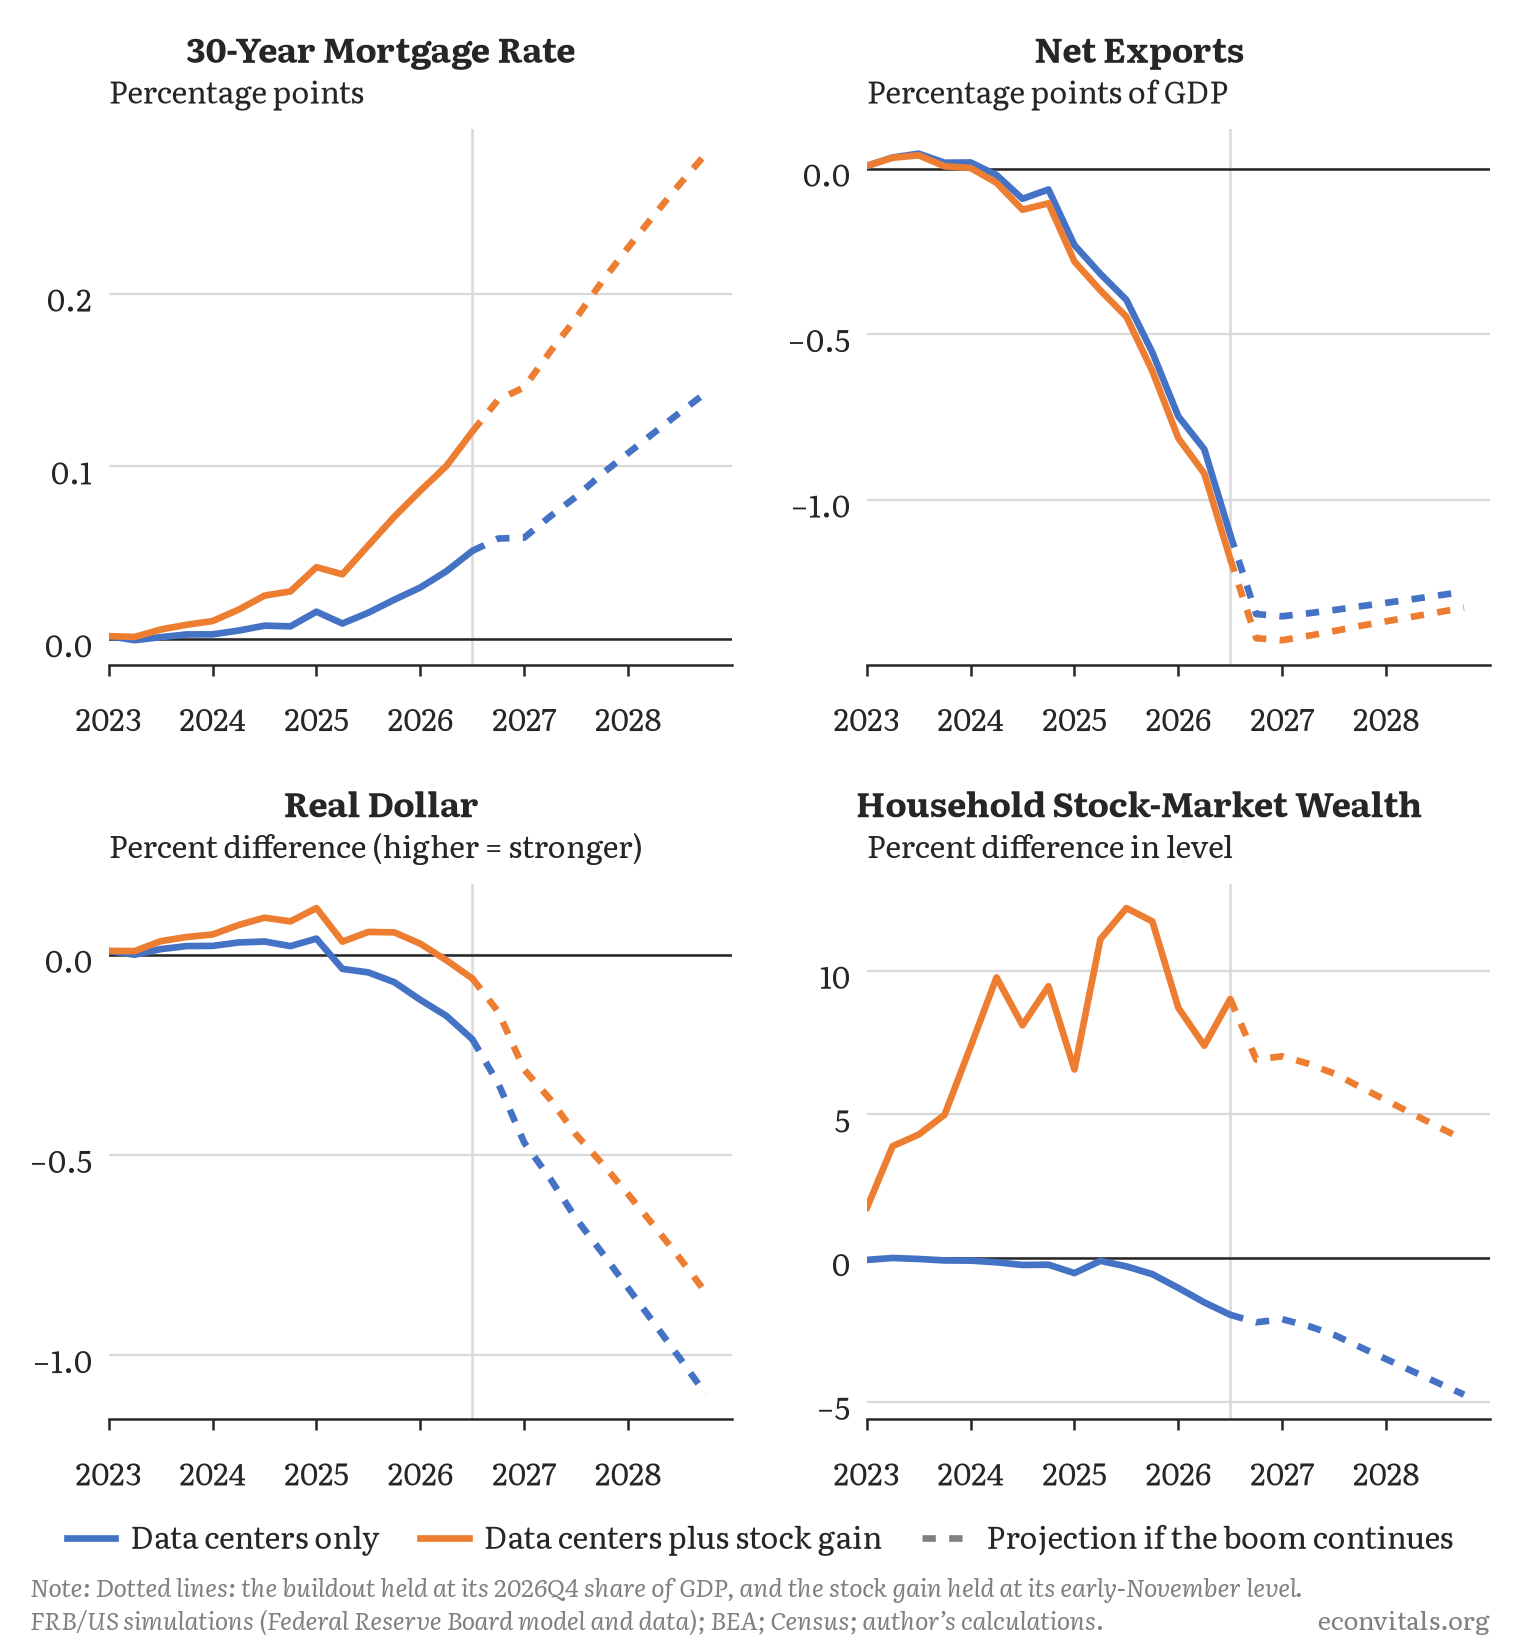
FRB/US gives a noticeably smaller number than this back-of-the-envelope math. In the model, the stock gain raises consumer spending by about 0.4 percent of GDP by the third quarter of 2026. I treat the stock gain as investors expecting higher earnings from these companies, not as investors accepting lower returns on stocks in general, so it works through household wealth rather than by making it cheaper for businesses to raise money; other business investment rises only a little, from the extra demand. Together, the buildout and the stock gain raise GDP by about 0.6 percent and lower the unemployment rate by about 0.3 percentage point, and the Fed’s rule responds with a funds rate about 0.35 percentage point higher. These graphs show the effect on GDP and unemployment of the stock gain on top of the data center buildout. If the buildout holds at its end-of-year share of GDP and the stock gain stays at its early-November level, but does not keep increasing, the effects build further, with GDP leveling off in 2028: by the end of 2028, GDP would be about 0.75 percent higher and the unemployment rate about 0.45 percentage point lower, with the funds rate about 0.7 percentage point higher.
Overall, adding the stock market boom to the buildout raises consumer spending by about 0.4 percent of GDP and other business investment by less than a tenth of a percent, while pulling in more imports from abroad; with backward-looking expectations, housing falls by about 0.3 percent from where it would otherwise be—with the effect potentially tripling over the next few years as the lagged effect of interest rates continues to work its way through the economy.
The AI boom kept the trade deficit from narrowing
One of the biggest effects of the boom has been to keep the trade deficit roughly constant as a share of GDP rather than falling meaningfully, which is what would have happened absent the boom. That fall could have been the result of the tariff increases, although tariffs have complex and ambiguous impacts on trade deficits, so other factors could be at play too. It would have brought the trade deficit to the lowest share of GDP since 1998.
The figure below shows net exports with and without the AI boom (the stock market part of it barely matters here).
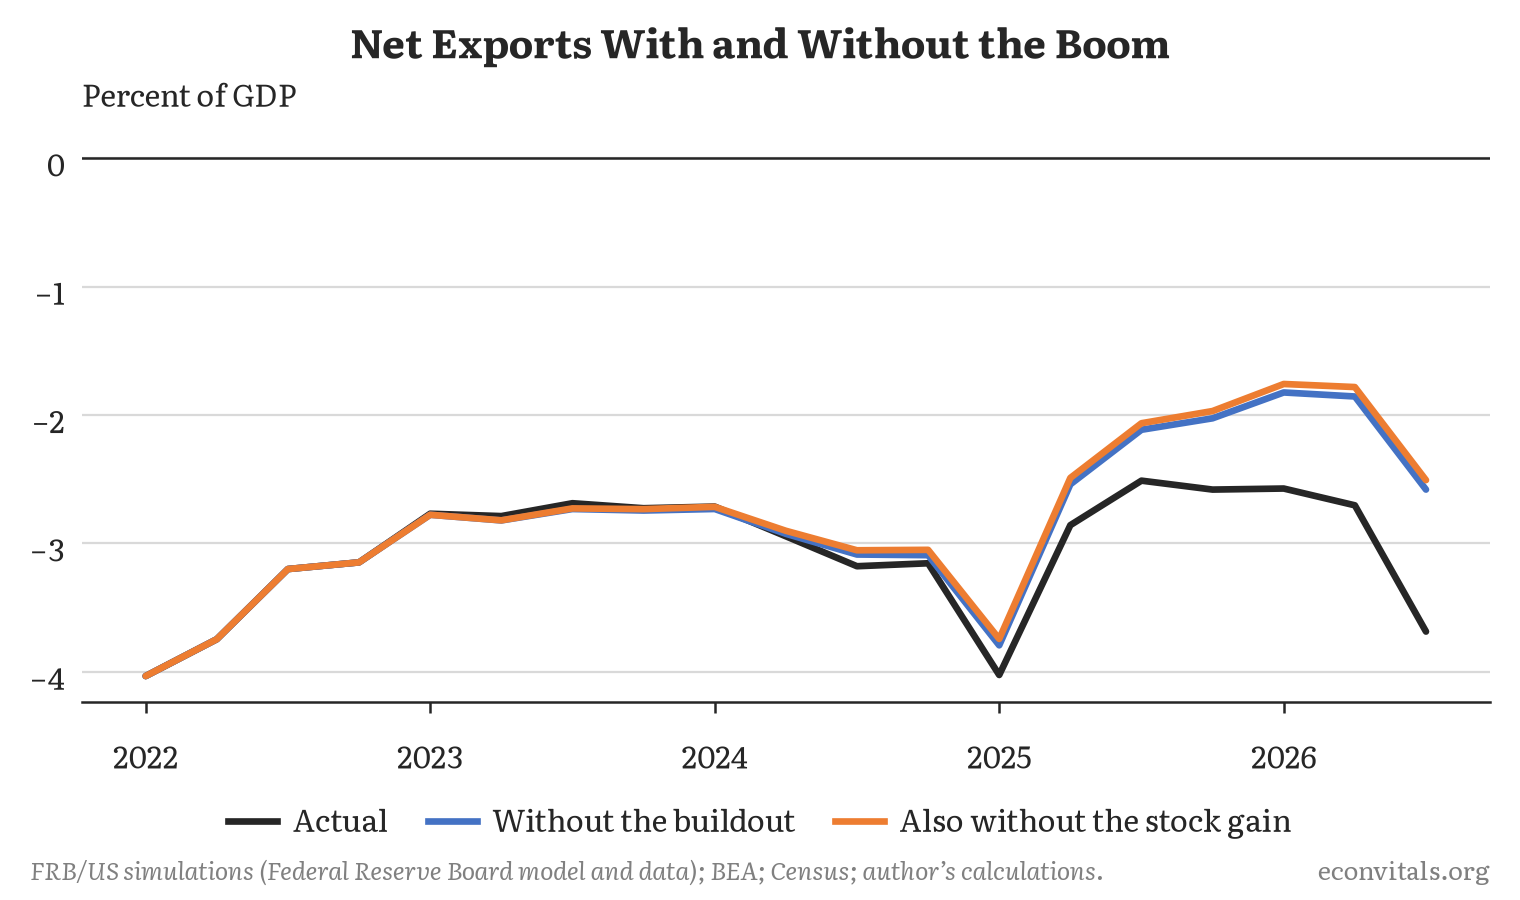
There are two ways to think about why the boom increased the trade deficit. The first is that it raised the imports of data-center-related stuff from its average over the years prior to the data center boom (note, these imports include items like computers used by consumers) of about 1¼ percent of GDP to about 3 percent of GDP so far this year. Absent a big depreciation in the exchange rate, this would not lead to any offsetting effects like lower imports of non-data-center stuff or higher exports. In fact, based on historical experience, investment booms often come with a stronger dollar, as foreign capital flows in—which itself would reduce net exports by even more than the naïve counterfactual of simply buying more foreign chips and other material. In these FRB/US simulations, though, the dollar barely moves, so this effect is not in the results shown here.
The other way to think about the expansion of the trade deficit is that the AI boom has added about 1.4 percentage points of GDP to investment while saving has risen only about a tenth of a percentage point of GDP. And the current account balance (or basically net exports) is the difference between saving and investment, so it has gotten about 1¼ percentage points of GDP lower as a result.
How much to trust this: a reasonable baseline, with expectations the big unknown
This analysis is based on the FRB/US model. Most of the effects are smaller than much of the discussion would suggest—and smaller than the historic scale of the investment. That is usually true in this and other macro models: huge tariff changes, oil shocks or departures from Fed policy tend to move the growth rate by tenths of a percentage point.
Sometimes the estimates in macro models are small because FRB/US and other models miss or minimize complexities like supply chains, the financial system and the liquidity constraints many households face. And the Fed’s model in particular was estimated largely on data from a relatively calm period, which is one reason it moves inflation so little—the Fed’s staff forecasts, which lean on FRB/US but add judgment and other models, famously failed to predict the inflation surge in 2021. Moreover, it assumes monetary policy responds effectively—without the serially correlated errors that often plague policymaking in the real world. These shortcomings can be especially severe in some cases, as in the financial crisis, whose full damage the model did not capture.
In the case of the AI buildout, the disadvantages of the model are less obviously serious, and its advantage of being able to track a sprawling and interconnected set of identities and empirical relationships is compelling. Still, there may be some limitations. For example, a model with a richer industrial structure would capture some of the bottlenecks that have added to surging prices of chips and other hardware—potentially adding more to inflation than this model shows.
Even more important is the role of expectations. The results I have presented assume backward-looking expectations. If you assume forward-looking expectations, it can change the results a lot. For example, in FRB/US if people expect the buildout to continue through 2031 and also for productivity growth to rise by 0.5 percentage point annually starting in 2027, that would raise the 10-year Treasury yield by about 75 basis points, compared with about 13 basis points with backward-looking expectations. This would, in aggregate, more than offset the gains from the stock market boom—although it would change the composition, with somewhat more consumer spending and much less housing—and leave GDP slightly lower and unemployment slightly higher than they would have been with no boom at all. The truth is probably somewhere in between the two cases. (In fact, if financial markets and wage setters turned forward-looking only this year, we would have much of the added interest rate increase without enough time for it to show up in the macroeconomic data in a large way—you can see these results and others on the website.)
Overall, I believe the smaller results are probably correct—and the model does not have the same incentives that public discussion has to exaggerate effects. That said, each tenth of a percent of GDP is about $30 billion—a big deal.
The future: a smaller buildout would be fine, a stock market fall less so, and broader financial risks are the unknown unknown
The two biggest questions for the future are whether the building boom will continue and whether productivity will eventually show up. These are related. AI meaningfully increasing productivity—which I am optimistic will happen—is probably a necessary condition for the boom to continue. If I am wrong and AI does not add to the economy, it would be hard to monetize.
AI showing up in productivity, however, is not a sufficient condition for the boom to continue. Public policy changes or the inability to monetize the investments—the latter is what I am really worried about—could stop the AI boom and associated stock market increase.
This analysis suggests that the economy could survive less data center buildout just fine. Investment would fall, but so would imports and interest rates, and GDP would be little changed. A broader fall in the stock market would be a bigger deal: if the buildout ended and the whole market fell by something like 30 percent, then the FRB/US model would predict that growth would slow to about 1½ percent—still not even a shallow recession.
Largely absent from this model (as we found out at our peril in the financial crisis) are the complexities of the financial system, including the unwinding of leverage. I hope to return to those another time and explain why I see them as a tail risk—at worst more like 2001 (a short, shallow recession) than 2007–09 (a financial crisis), and even that is only a risk.
The bottom line: so far the AI economy is less a story about data centers than about the stock market—and that is also where the risk is.
Note: This post was written by Jason with title, copyedits and fact checks by Claude. The data work was done interactively with Claude. A replication package is available on Econvitals.
APPENDIX: FULL SET OF RESULTS
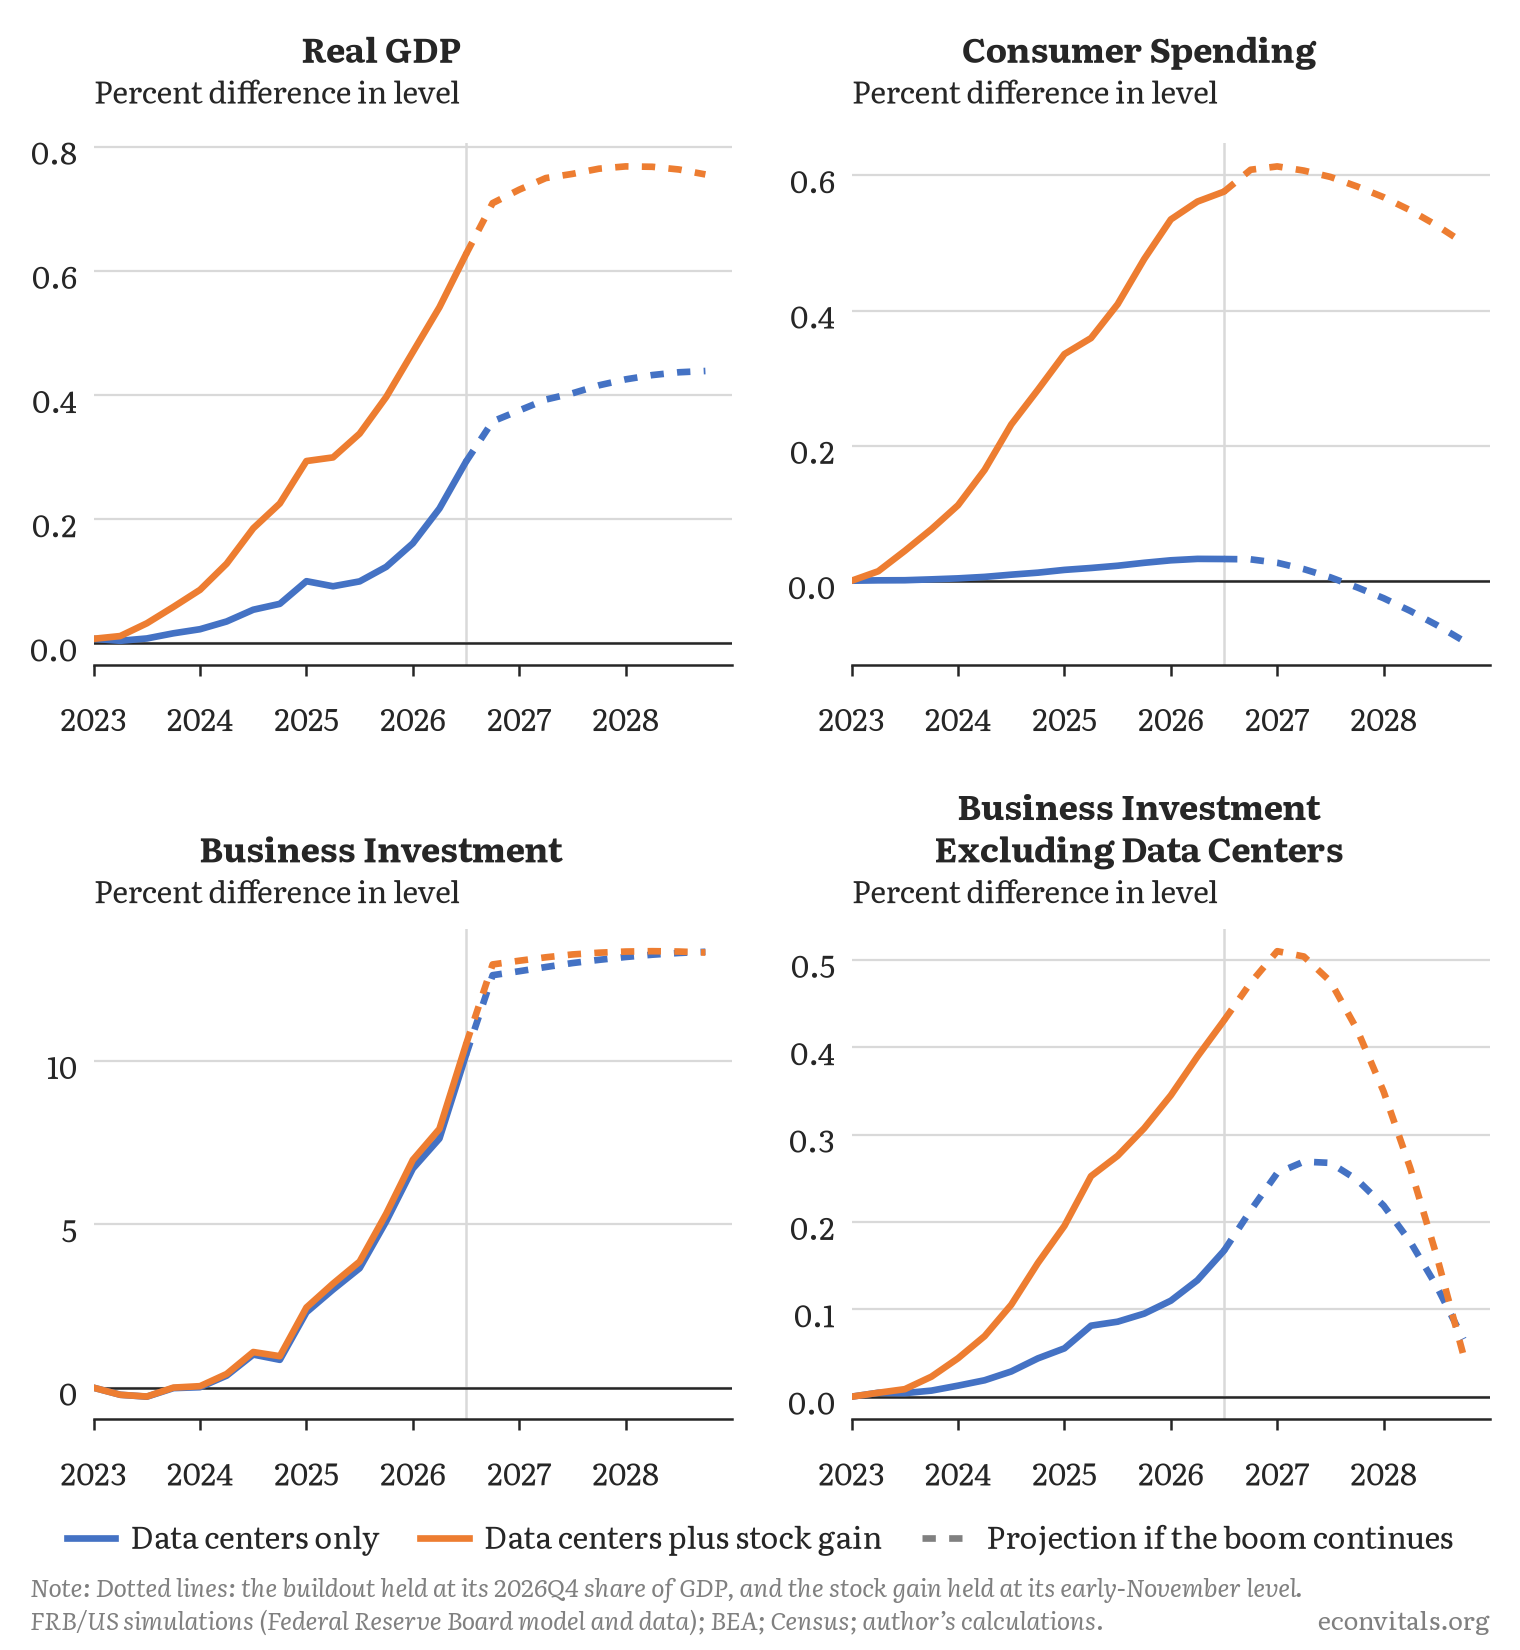
Each panel traces out the economic changes that have resulted, and will result, from the data center buildout alone (blue) and the buildout plus the AI stock gain (orange). Solid lines run through the third quarter of 2026, the last quarter of actual data. The dotted lines assume the buildout rises to 1.6 percent of GDP in the fourth quarter and stays there, and that the stock gains stay at their early-November level, without further extraordinary growth. The simulations assume backward-looking expectations and the Fed’s inertial policy rule—you can set other assumptions on the website.
Jason’s Occasional Posts are written by Jason himself; almost everything else on Econvitals is written by Claude. Subscribe to get them by email, or read the others.